NHL Alignment and Playoff Format Re-Designs
This is a broad design research project aimed at optimizing the National Hockey League’s playoff format, as well as its division and conference alignments.
As a long time fan of the league, I have been able to articulate what I believe to be the most significant research concerns that would lead to effective solutions. The concerns are geographic alignment/travel, time zone travel, rivalry building and sustaining, market support, fairness, and complexity.
No one alignment and playoff format can address all of these research concerns equally well, so this project proposes a range of solutions, each of which addresses a different combination of concerns.
For a historical look at the NHL’s three most recent alignment and playoff formats, to which I make many comparisons throughout this project, see:
I began with an initial exploration phase in which I largely explored different alignment formats rather than playoff formats. This was conducted while there were still only 30 teams in the NHL, a solution was needed to accommodate the moving of the Atlanta Thrashers to Winnipeg, and there was no clear vision for when or to where expansion would occur.
Next, I began a first phase of playoff format proposals that I created once I had the above mentioned research concerns defined, which included:
Finally, I moved into a second phase of playoff format proposals and adjustments to the previous formats that came from the many new aspects of schedule, alignment and playoff format design that I learned throughout the process to this point, which included:
For the schedule and playoff formats, I developed an evaluation method that approximates empirical numerical values for each of the research concerns, and present my findings in a clear and concise series of data visualizations.
In order to show the work that I completed leading up to these conclusions, I have written about the research concerns, evaluation methods, findings and statistical analysis, and my overall conclusions on this page, organized as such:
Geographic Alignment/Travel
The primary reason for having conferences and divisions in sports is to align teams into the most geographically sensible arrangement, and tailor the teams’ schedules so that they play more games against division and conference rivals than against other teams. The less the players need to travel when on the road, or when leaving their home city and travelling to another, the lower the expenses and the fatigue on the part of the players. These are benefits to the game being played at its peak.
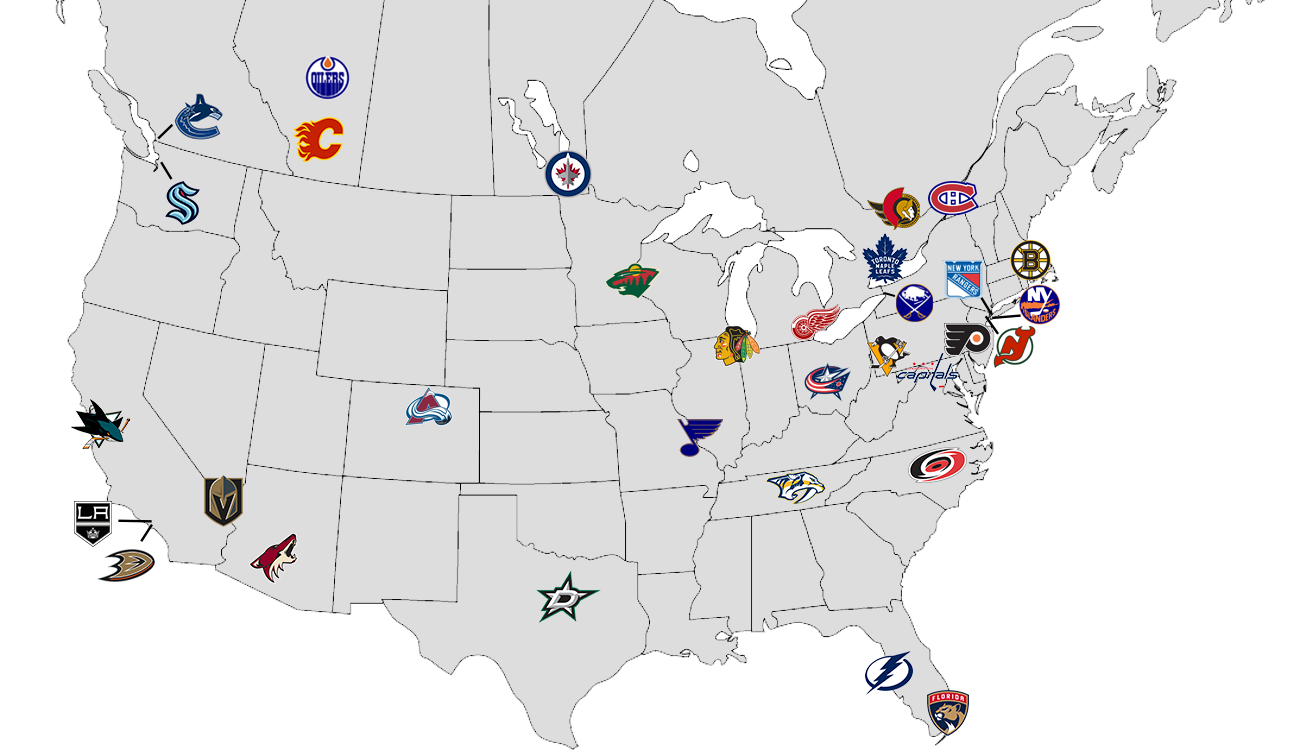
The NHL is a league in which the locations of its teams are very concentrated in some areas of North America, and very sparse in others, so geographic alignment is a challenge.
Past alignments in the NHL have had divisions that cover a wide span of time zones, which has been found to be an issue. While travelling long distances is not ideal for players’ energy levels while playing, the more significant factor is time zone travel, when teams cross time zones to travel to a game. When this happens, they play at a different time than they are used to (sometimes significantly different), so it creates much more wear and disruption to their routines.
Perhaps more important, though, is the effect on fans: since games generally start at 7:00pm local time, a fan watching their team play on the road has to tune in at times such as 4:00 or 10:00pm, depending on what time zone they are in, and what time zone their team is playing in. A hockey game takes approximately 2.5 hours to be played, so the Eastern fan that watches their team play a Pacific opponent will have to watch until about 12:30am. Meanwhile, the Pacific fan whose team is playing a Central opponent will most likely just be getting off work when the game begins, at 5:00pm.
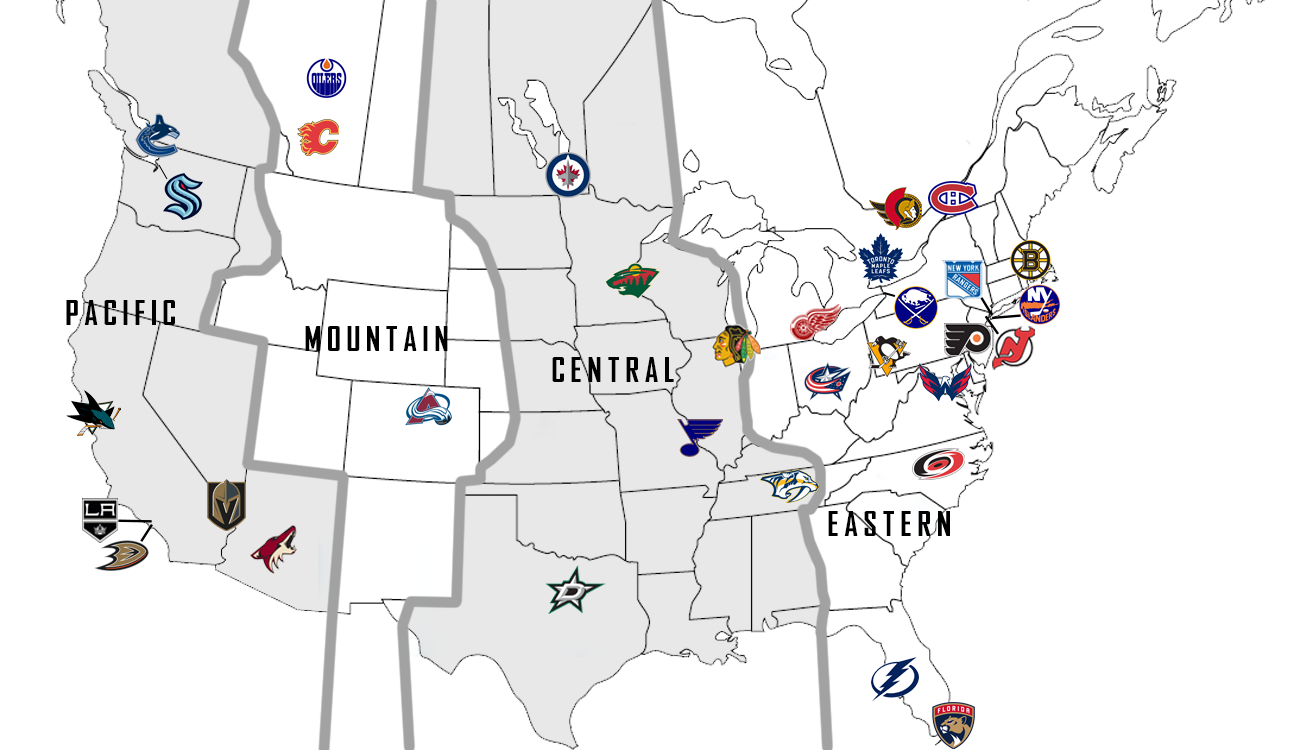
For these reasons, minimizing the number of times teams must play well outside their time zones is crucial to a good alignment. Each NHL team generally plays their inter-division rivals the most, then their inter-conference rivals, and the teams outside their conference the least, so I avoid having divisions span 3 time zones (a 1 hour difference in TV start times shouldn’t be significant, but a 2 hour difference is).
Rivalry Building and Sustaining
 For the NHL to be a healthy league, it needs to draw a lot of fan interest in their teams’ games, and grouping teams together that have some sort of rivalry usually accomplishes this, whether it is a geographic rivalry, due to a history between two teams and/or cities, or for other reasons.
Rivalries in the NHL have much history, for example, the 30 year period when the NHL was comprised of just six teams (the “Original Six”: New York Rangers, Montreal Canadiens, Boston Bruins, Chicago Blackhawks, Toronto Maple Leafs and Detroit Red Wings). These 6 teams have largely grown apart, since their history makes them large, attractive markets that can help support other teams, but they still maintain some significant rivalries with one another because of that history.
Other rivalries can be created by significant events in the playoffs, or even just in the regular season, where reasons to look forward to playing a specific team are created, for example, the multiple intense playoff matchups between the Colorado Avalanche and Detroit Red Wings from 1996-2002, which created fan anticipation for games between these teams for many years.
For alignment decisions that are meant to be permanent, quite a few things need to be analyzed and agreed upon, and few of them are easy decisions to make. There certainly is not any obvious “best” alignment, otherwise, there would not be much of a designerly problem to solve here.
 As mentioned above, supporting weak and/or new markets in the NHL is important for its long-term health. When a new team joins the NHL, its city usually does not have any past with hockey or pre-existing rivalries other than possibly geographical ones. So, fans usually are most interested in seeing well-known teams with some history, since they are more likely to know about them.
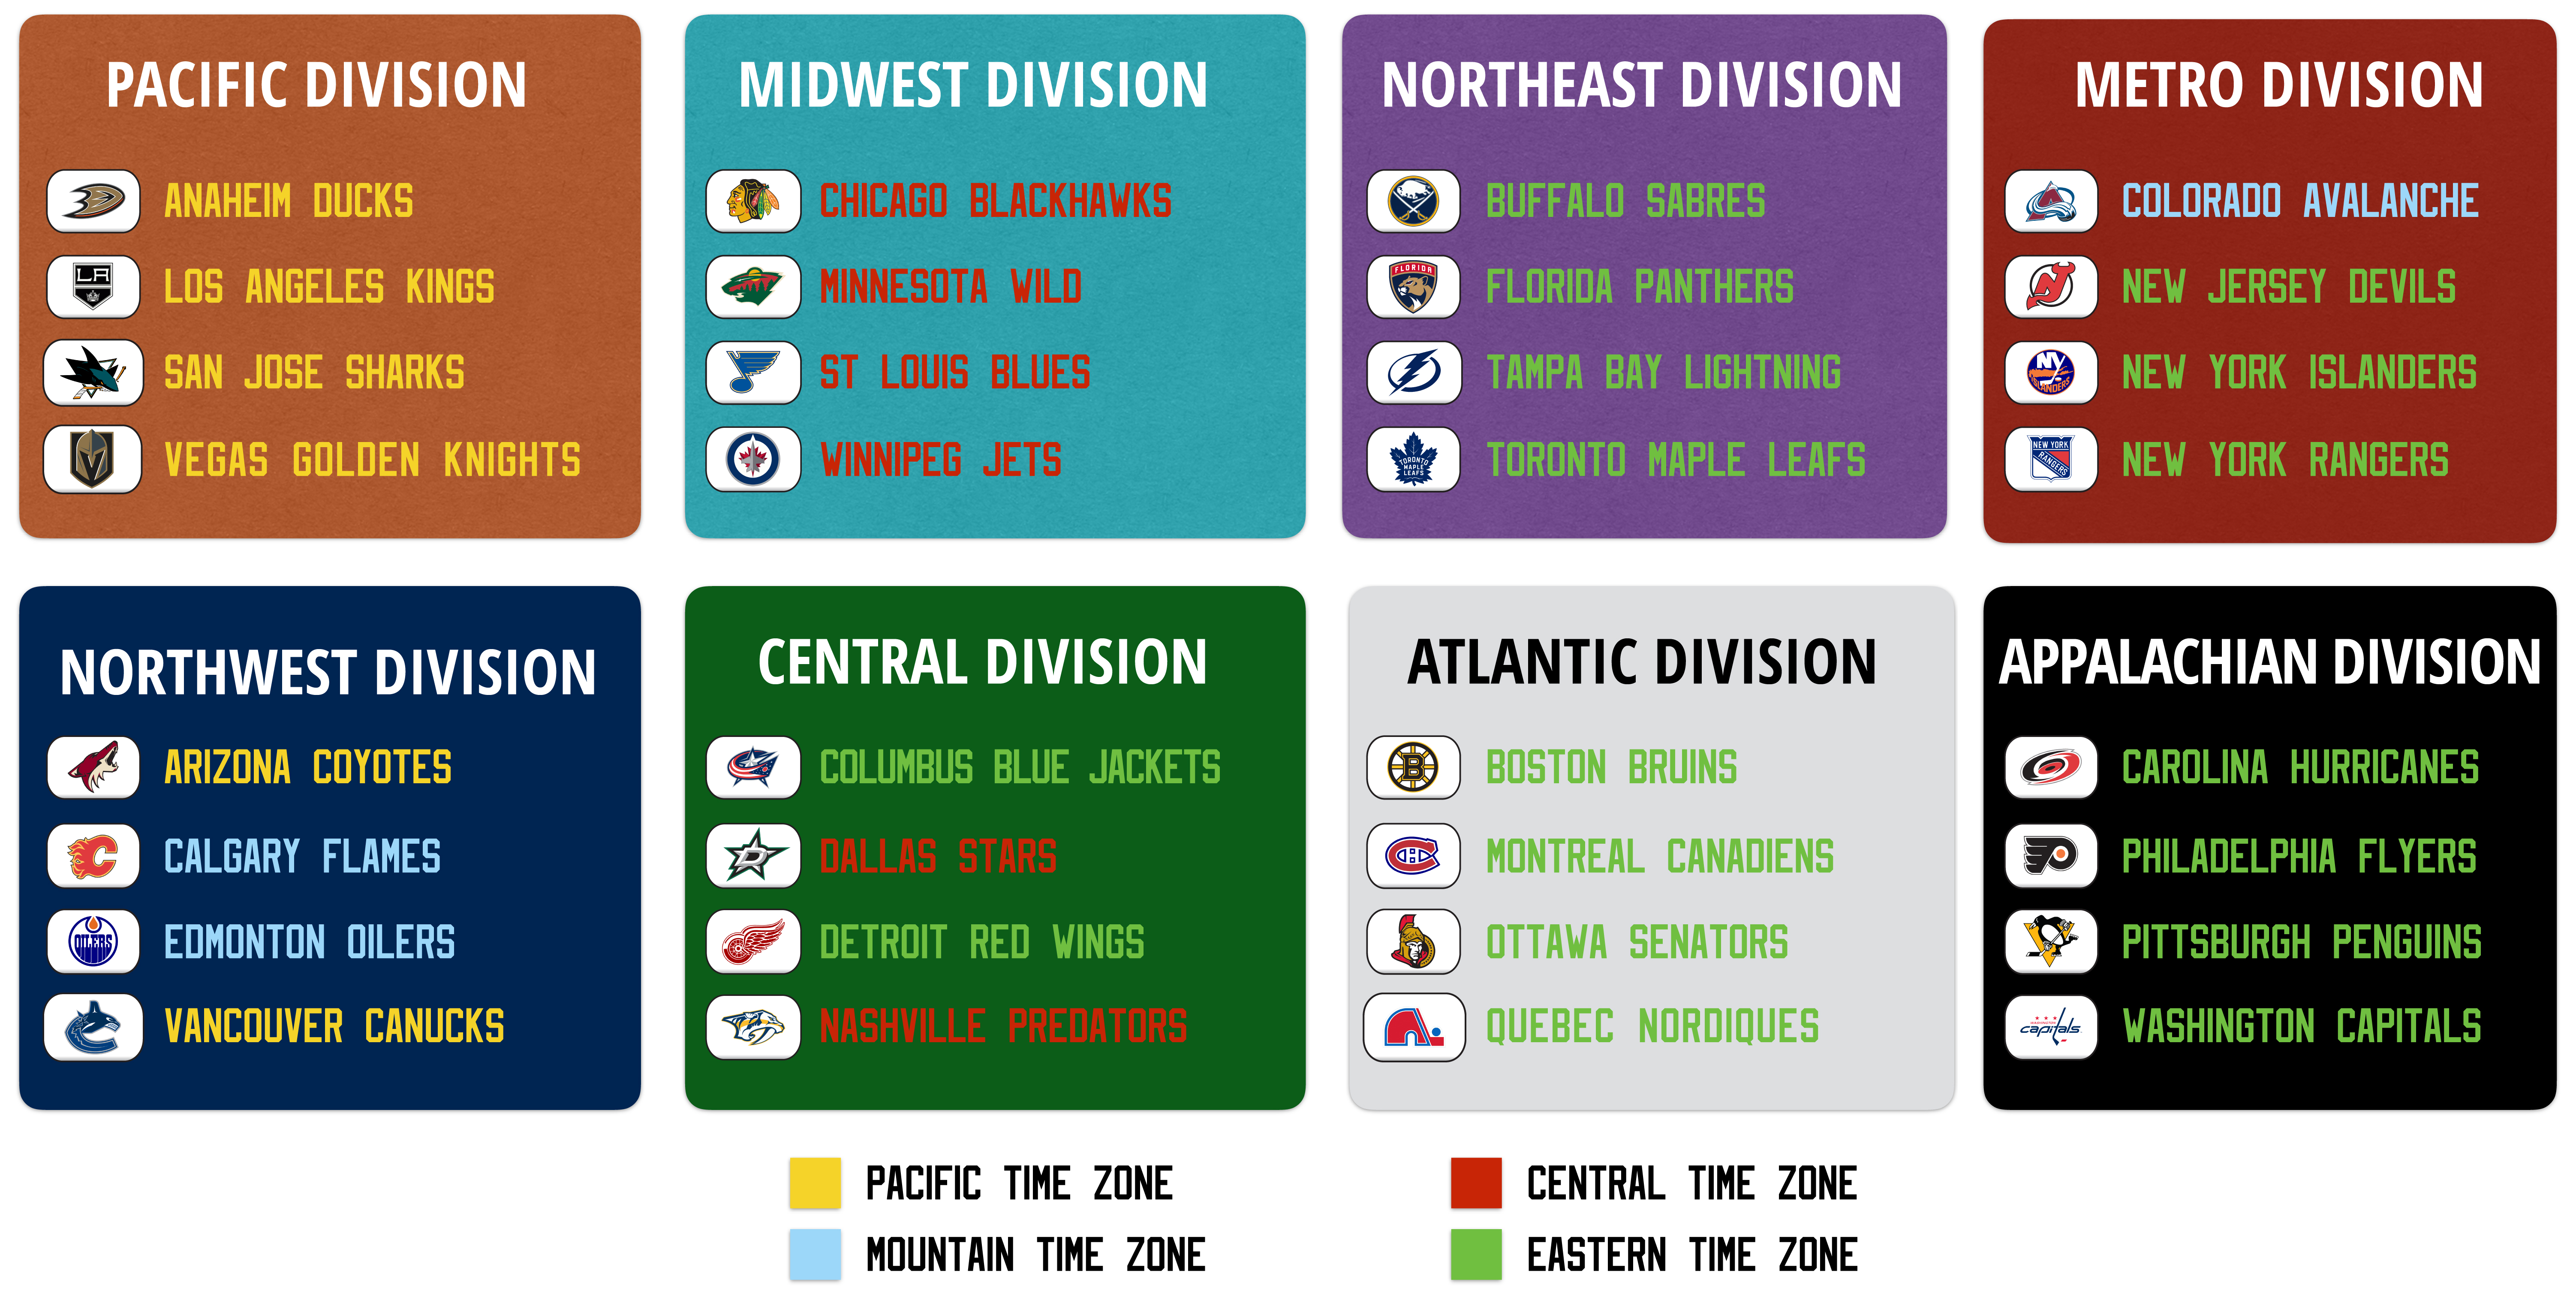
As a result, the biggest markets and teams with the most history should be distributed among the divisions and conferences in a workable way to support the success of the weaker, newer markets. This is why the Southeast Division, which existed from 1999-2013 and was made up of only one team that existed before 1993 was a failure; the teams that fans in that division saw the most were other new teams with little history, so they did not have much to interest them.
I believe that there is a distinct “Big 8” to the NHL markets, in terms of which are the most appealing to each other market (with some variation). Those Big 8 markets are the original 6 (Boston, Chicago, Detroit, Montreal, New York (Rangers), Toronto), plus Philadelphia and Los Angeles. These are the markets that are the best combination of the market size, the significance of its hockey history, the age of the team, and its iconic, relatively consistent brand.
Generally, these 8 teams are more appealing than others in each market to consume games against, with the one possible exception being teams in the Eastern time zone not finding games versus Los Angeles particularly appealing due to being so distant. Every other team that currently has significant appeal, such as Pittsburgh, Washington, Vegas, etc, do not have enduring appeal, in my opinion, but appeal that is tied to specific star players, or to the novelty of being new and entertaining.
 “Fairness” in a playoff format means that it is most likely (within other constraints) for the teams that have the best regular season records to draw the teams with the worst regular season records, hypothetically giving the best teams from regular season play the greatest advantages when the playoffs begin.
It also refers to the need to have every team in the league have as close to an even chance to make the playoffs as possible (so in the case of divisions and conferences with different numbers of teams in them, if an equal number of teams across those groups are given playoff spots, the format is not fair because that would give the teams in the smaller groups an advantage).
While adhering to fair matchups and equal playoff odds as much as possible could be desirable, it inevitably negatively impacts other aspects (time zone travel, likelihood of rivalries), so there is normally a balance struck between fairness and these other aspects in each format.
Another factor that only impacts playoff formats: complexity refers to how simple or complex it is for fans (even casual fans) to understand the playoff format that is in use. This means that it should be easy for them to know whether or not their team is in a playoff spot (or how far away from one they are), and if they are, it should be easy to work out which team they would face, or which teams they are most likely to face in the playoffs.
Naturally, this factor lends itself to formats where teams are organized into groups (divisions or conferences, typically) of set, even numbers of teams within them, and only the top X number of teams make the playoffs. Additionally, these set groups should assign numbers to each team within them (usually referred to as a team’s “seed”) and this number should dictate which teams play each other.
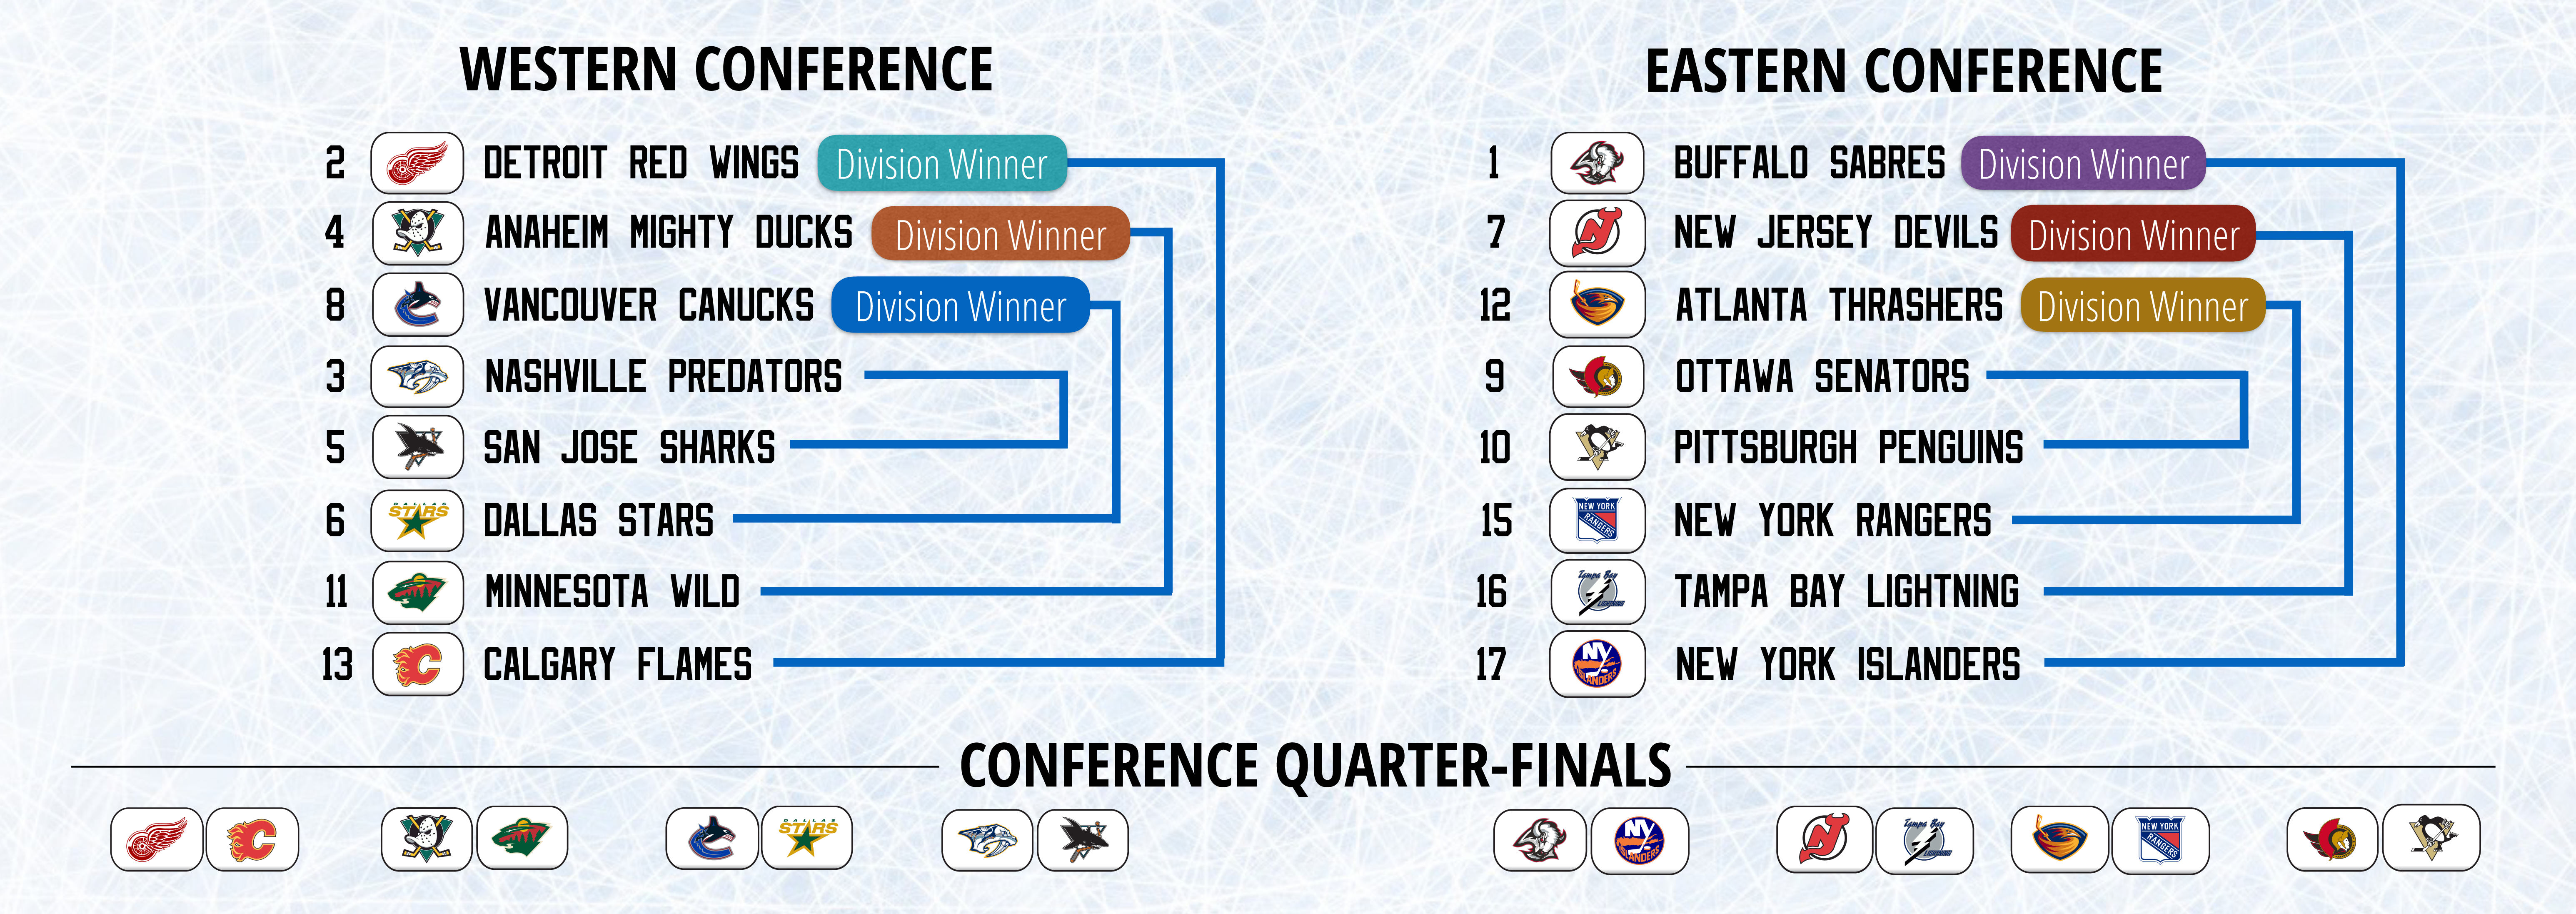
For example, in the Divisional format, there are four teams in each Division that make the playoffs, and the #1 and #4 teams, as well as #2 and #3, play each other every time. In the Conference format, a similar idea is used: instead of four Divisions with four teams making the playoffs in each, there are two Conferences, and each allows eight teams to make the playoffs, and they are matched up every time as follows: #1 vs. #8, #2 vs. #7, #3 vs. #6, and #4 vs. #5.
Although both the Division and Conference formats follow this rule in order to be fairer (highest teams vs. lowest teams), the act of grouping teams itself can have a very harmful effect on fairness, since one or more group of teams can be much stronger or weaker than others in any given playoff year, which results in less fair matchups because of the way teams are forced to match up against opponents within their group.
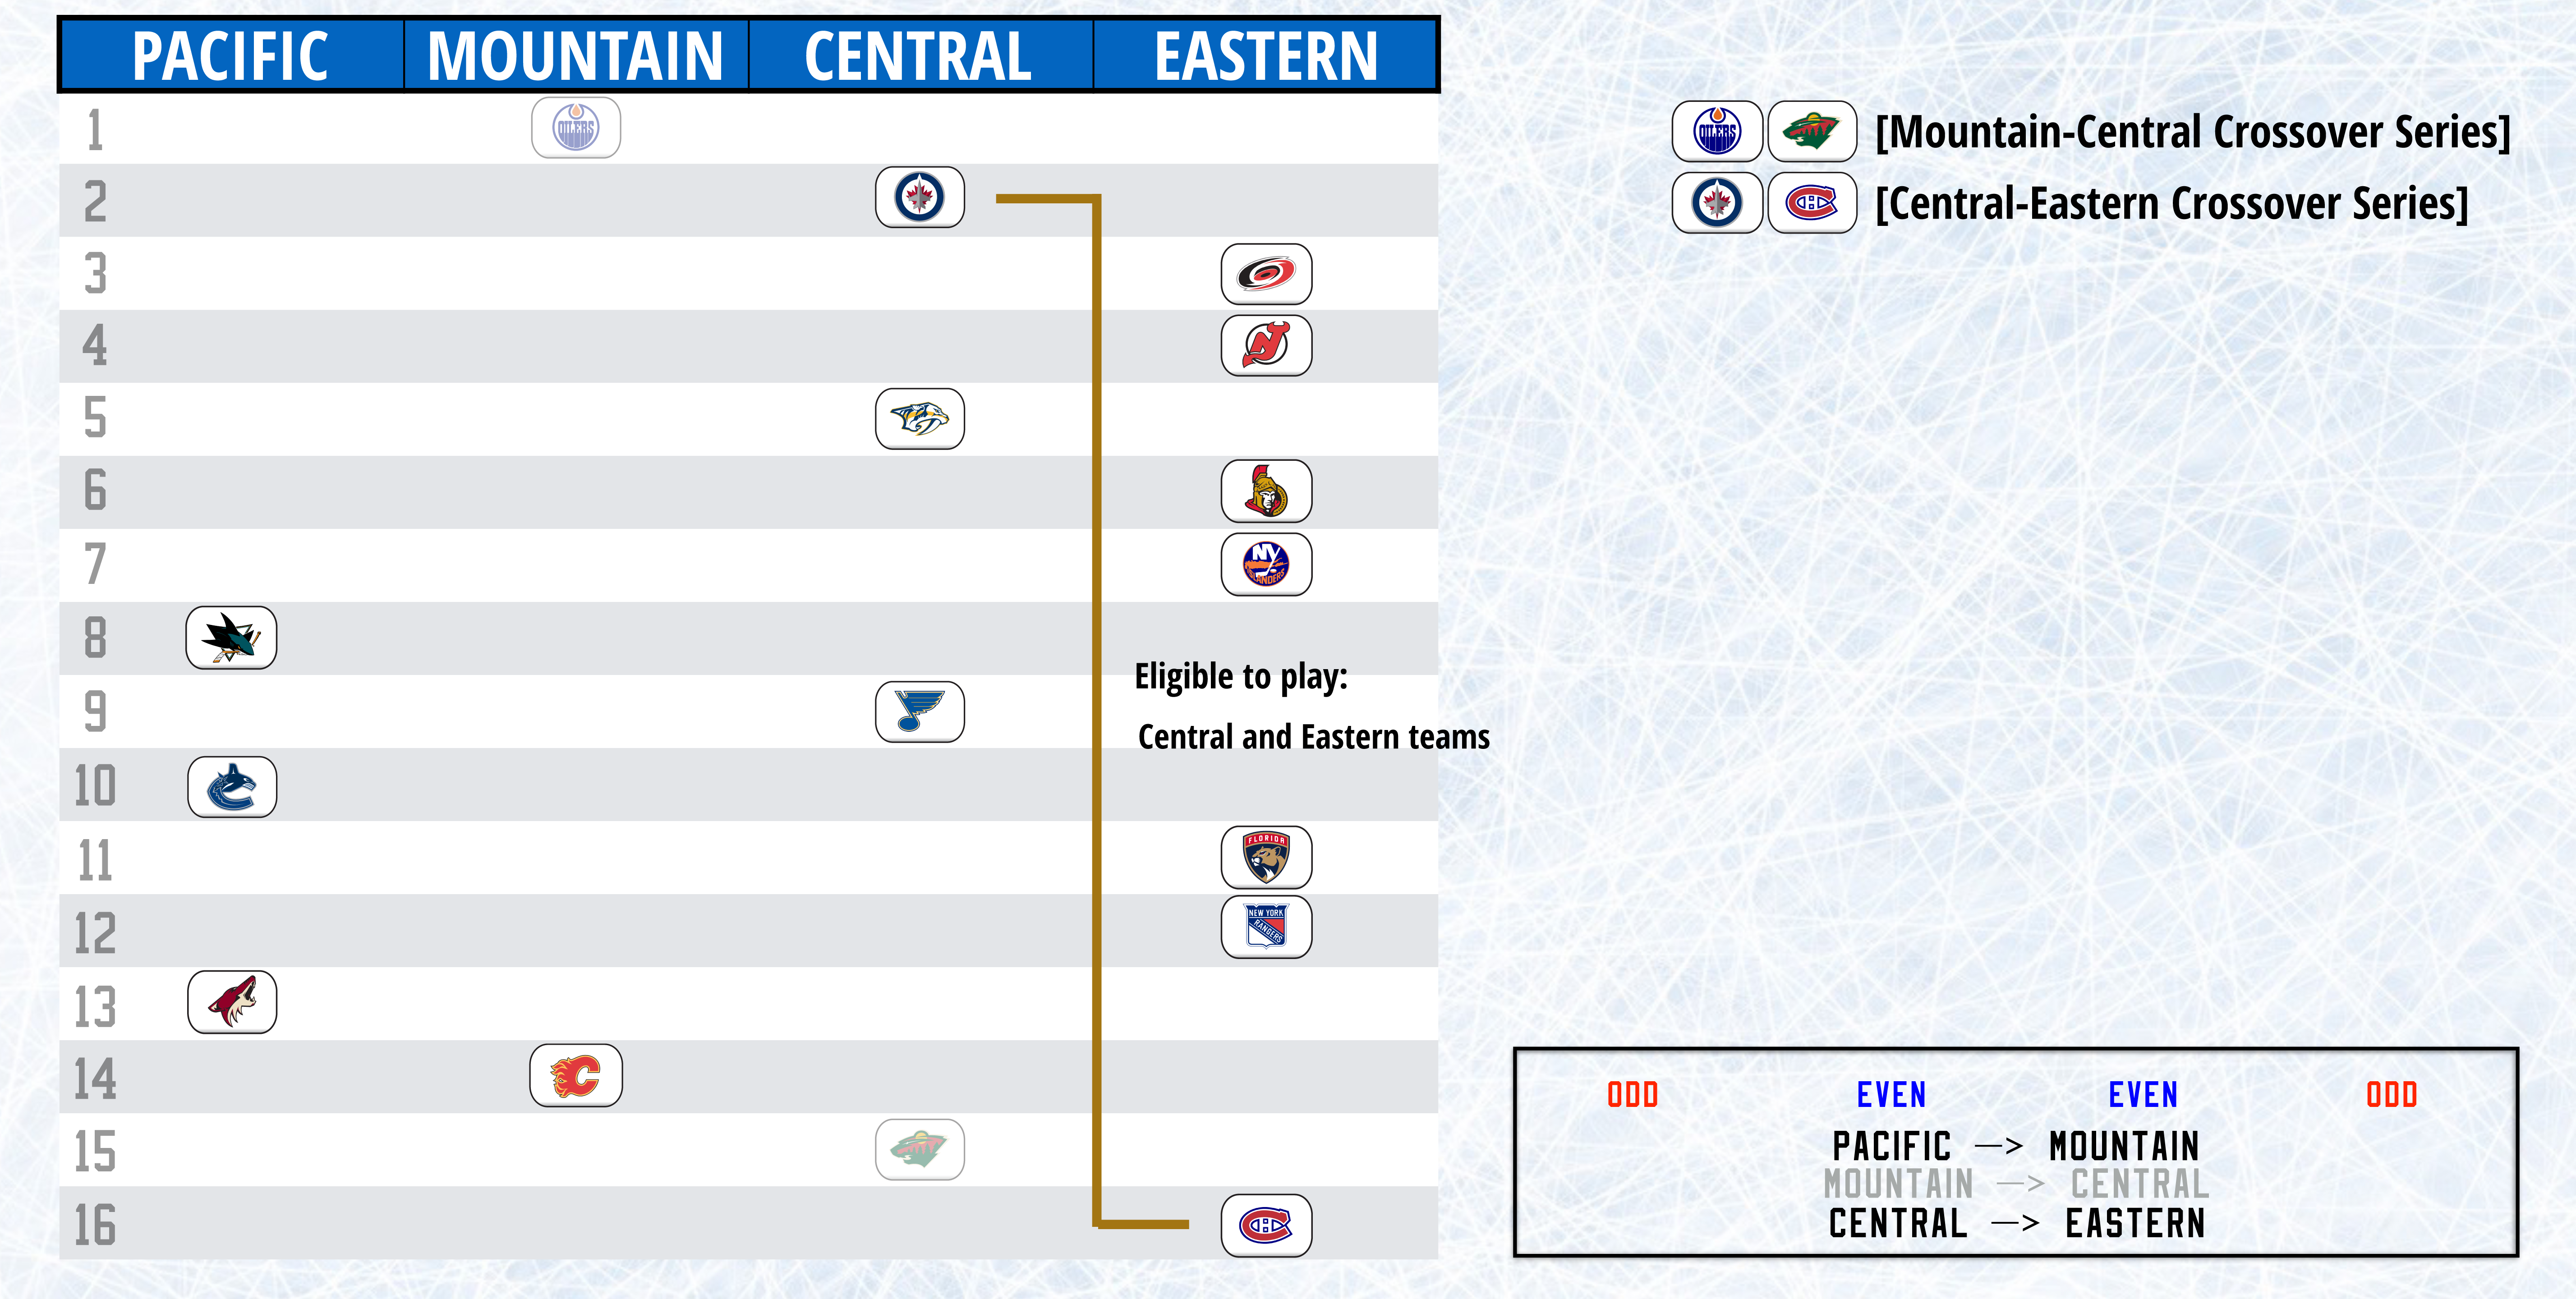
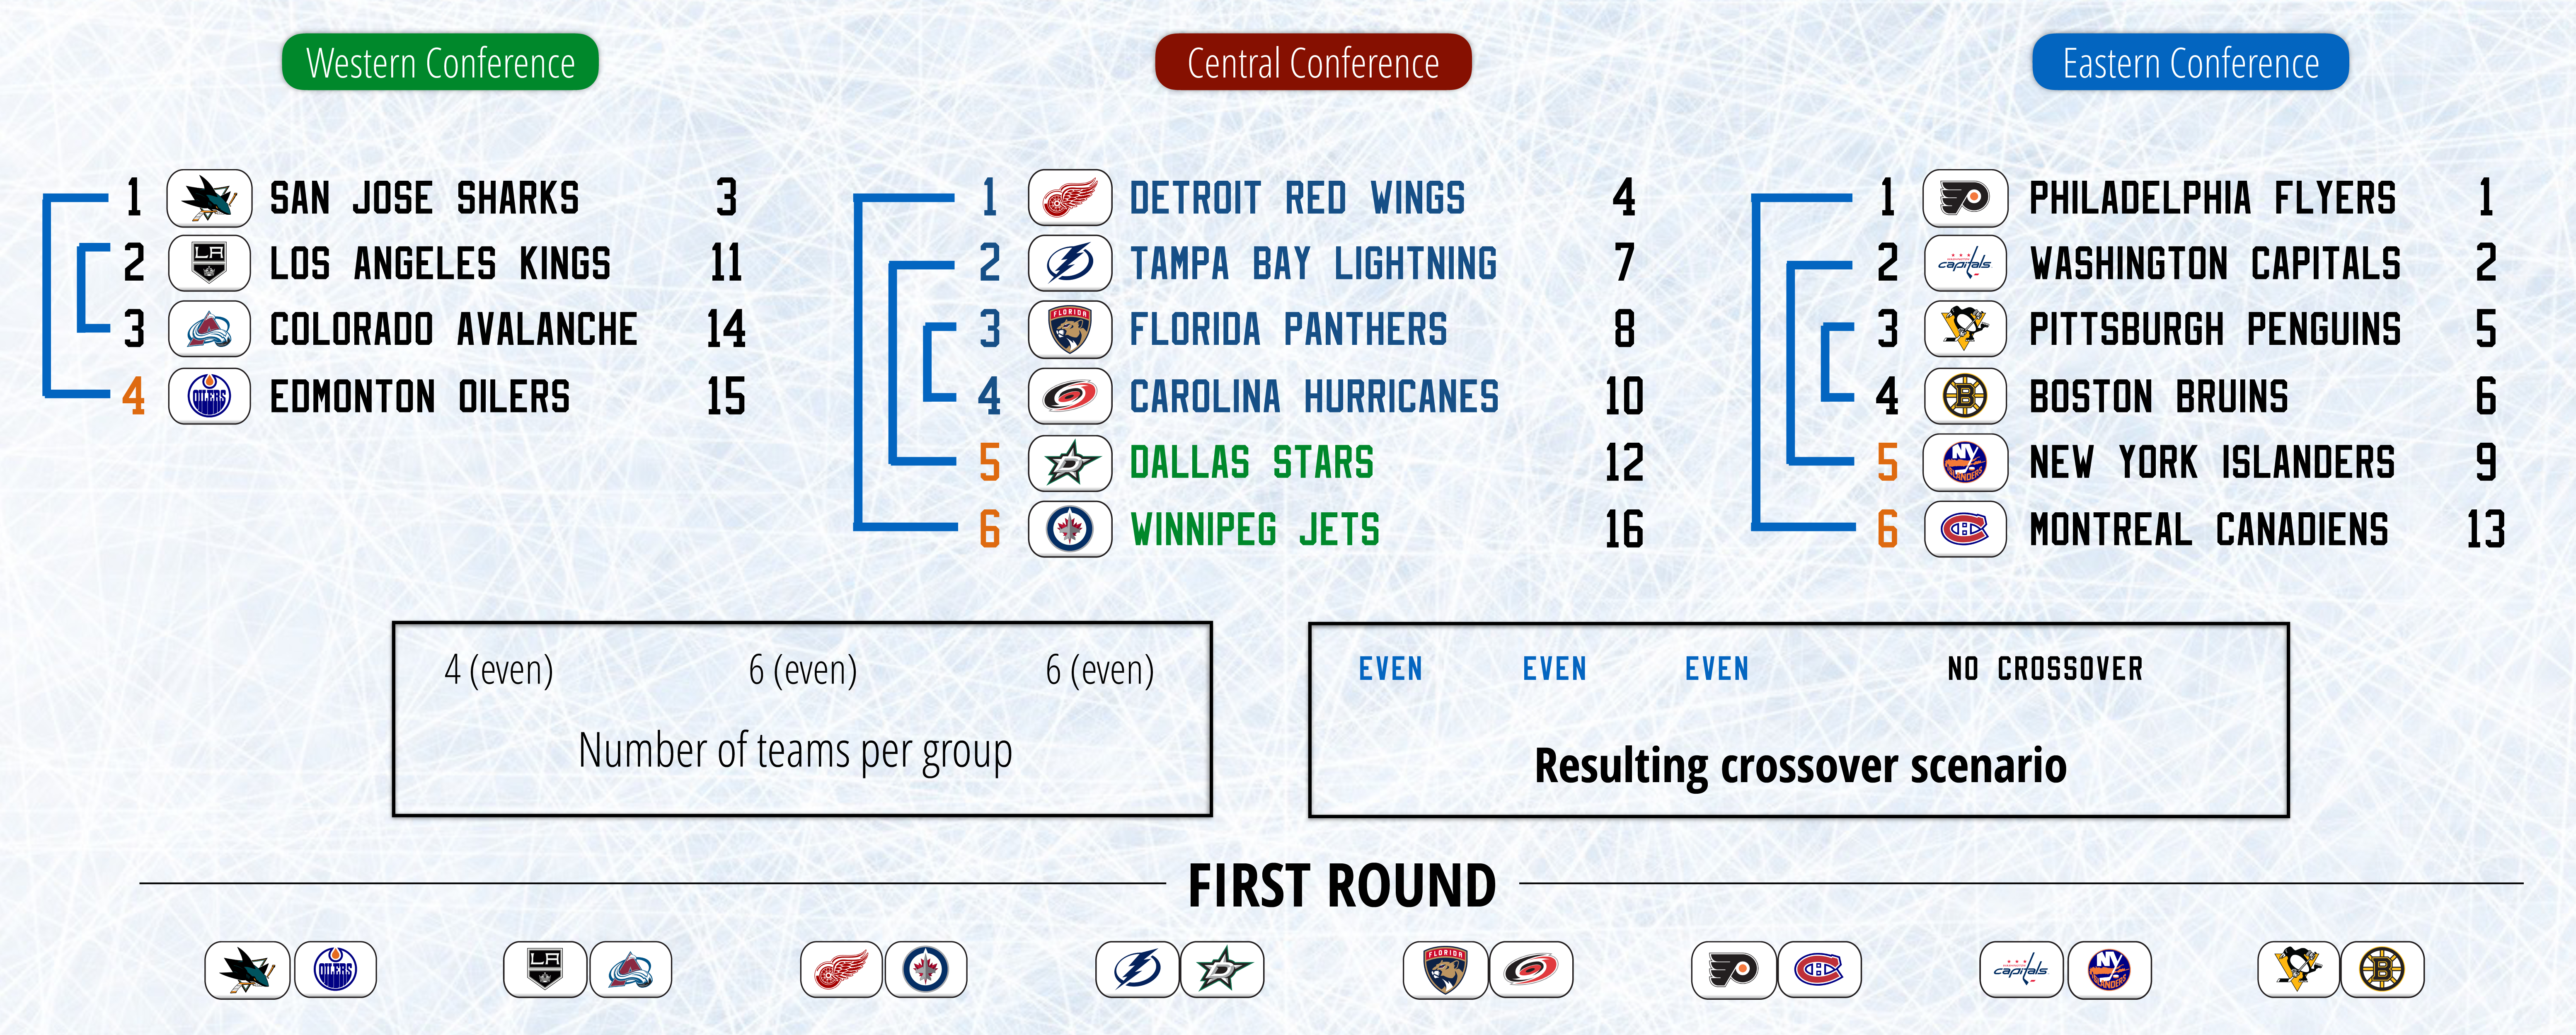
Sports leagues rarely venture away from set groups with set seeding positions matching up against one another in their playoff formats, since highly complex playoff formats are usually considered very detrimental to their success. However, while I consider it a highly important factor, I am willing to venture into more complex territory depending on the benefits achieved towards the other research concerns I have outlined. This means sometimes delving into the world of crossover matchups, having to even out odd numbered groups, and even prioritizing specific rivalry matchups in a totally unstructured fashion.
 Analyzing the findings of all these formats requires looking into the main research concerns I outlined at the beginning of the project and attempting to numerically validate them.
To do so, I had to simulate a large sample size of seasons, in which I randomized both the league-wide standings, and assigned random numerical values to each team to determine which of them would win if they met in a playoff series, so that I could simulate entire playoff runs and have all the basis for comparison that whole playoff years entail.
I chose to create four sets of 20 test seasons, and compared the simulations to each other for each standard format (Divisional, Conference and Wild Card) and each of my main proposals. Here is my approach to numerically validating these simulations:
Geographic Appropriateness & Time Zone Travel
For geographic alignment in general, I was interested in projecting how much travel each team would need to go through during the regular season in each format, with the totals added together for all teams and compared between formats. However, actual travel in a NHL regular season relies on actually constructing a schedule within the format’s parameters and calculating the distance of each trip every team has to make, which was not feasible.
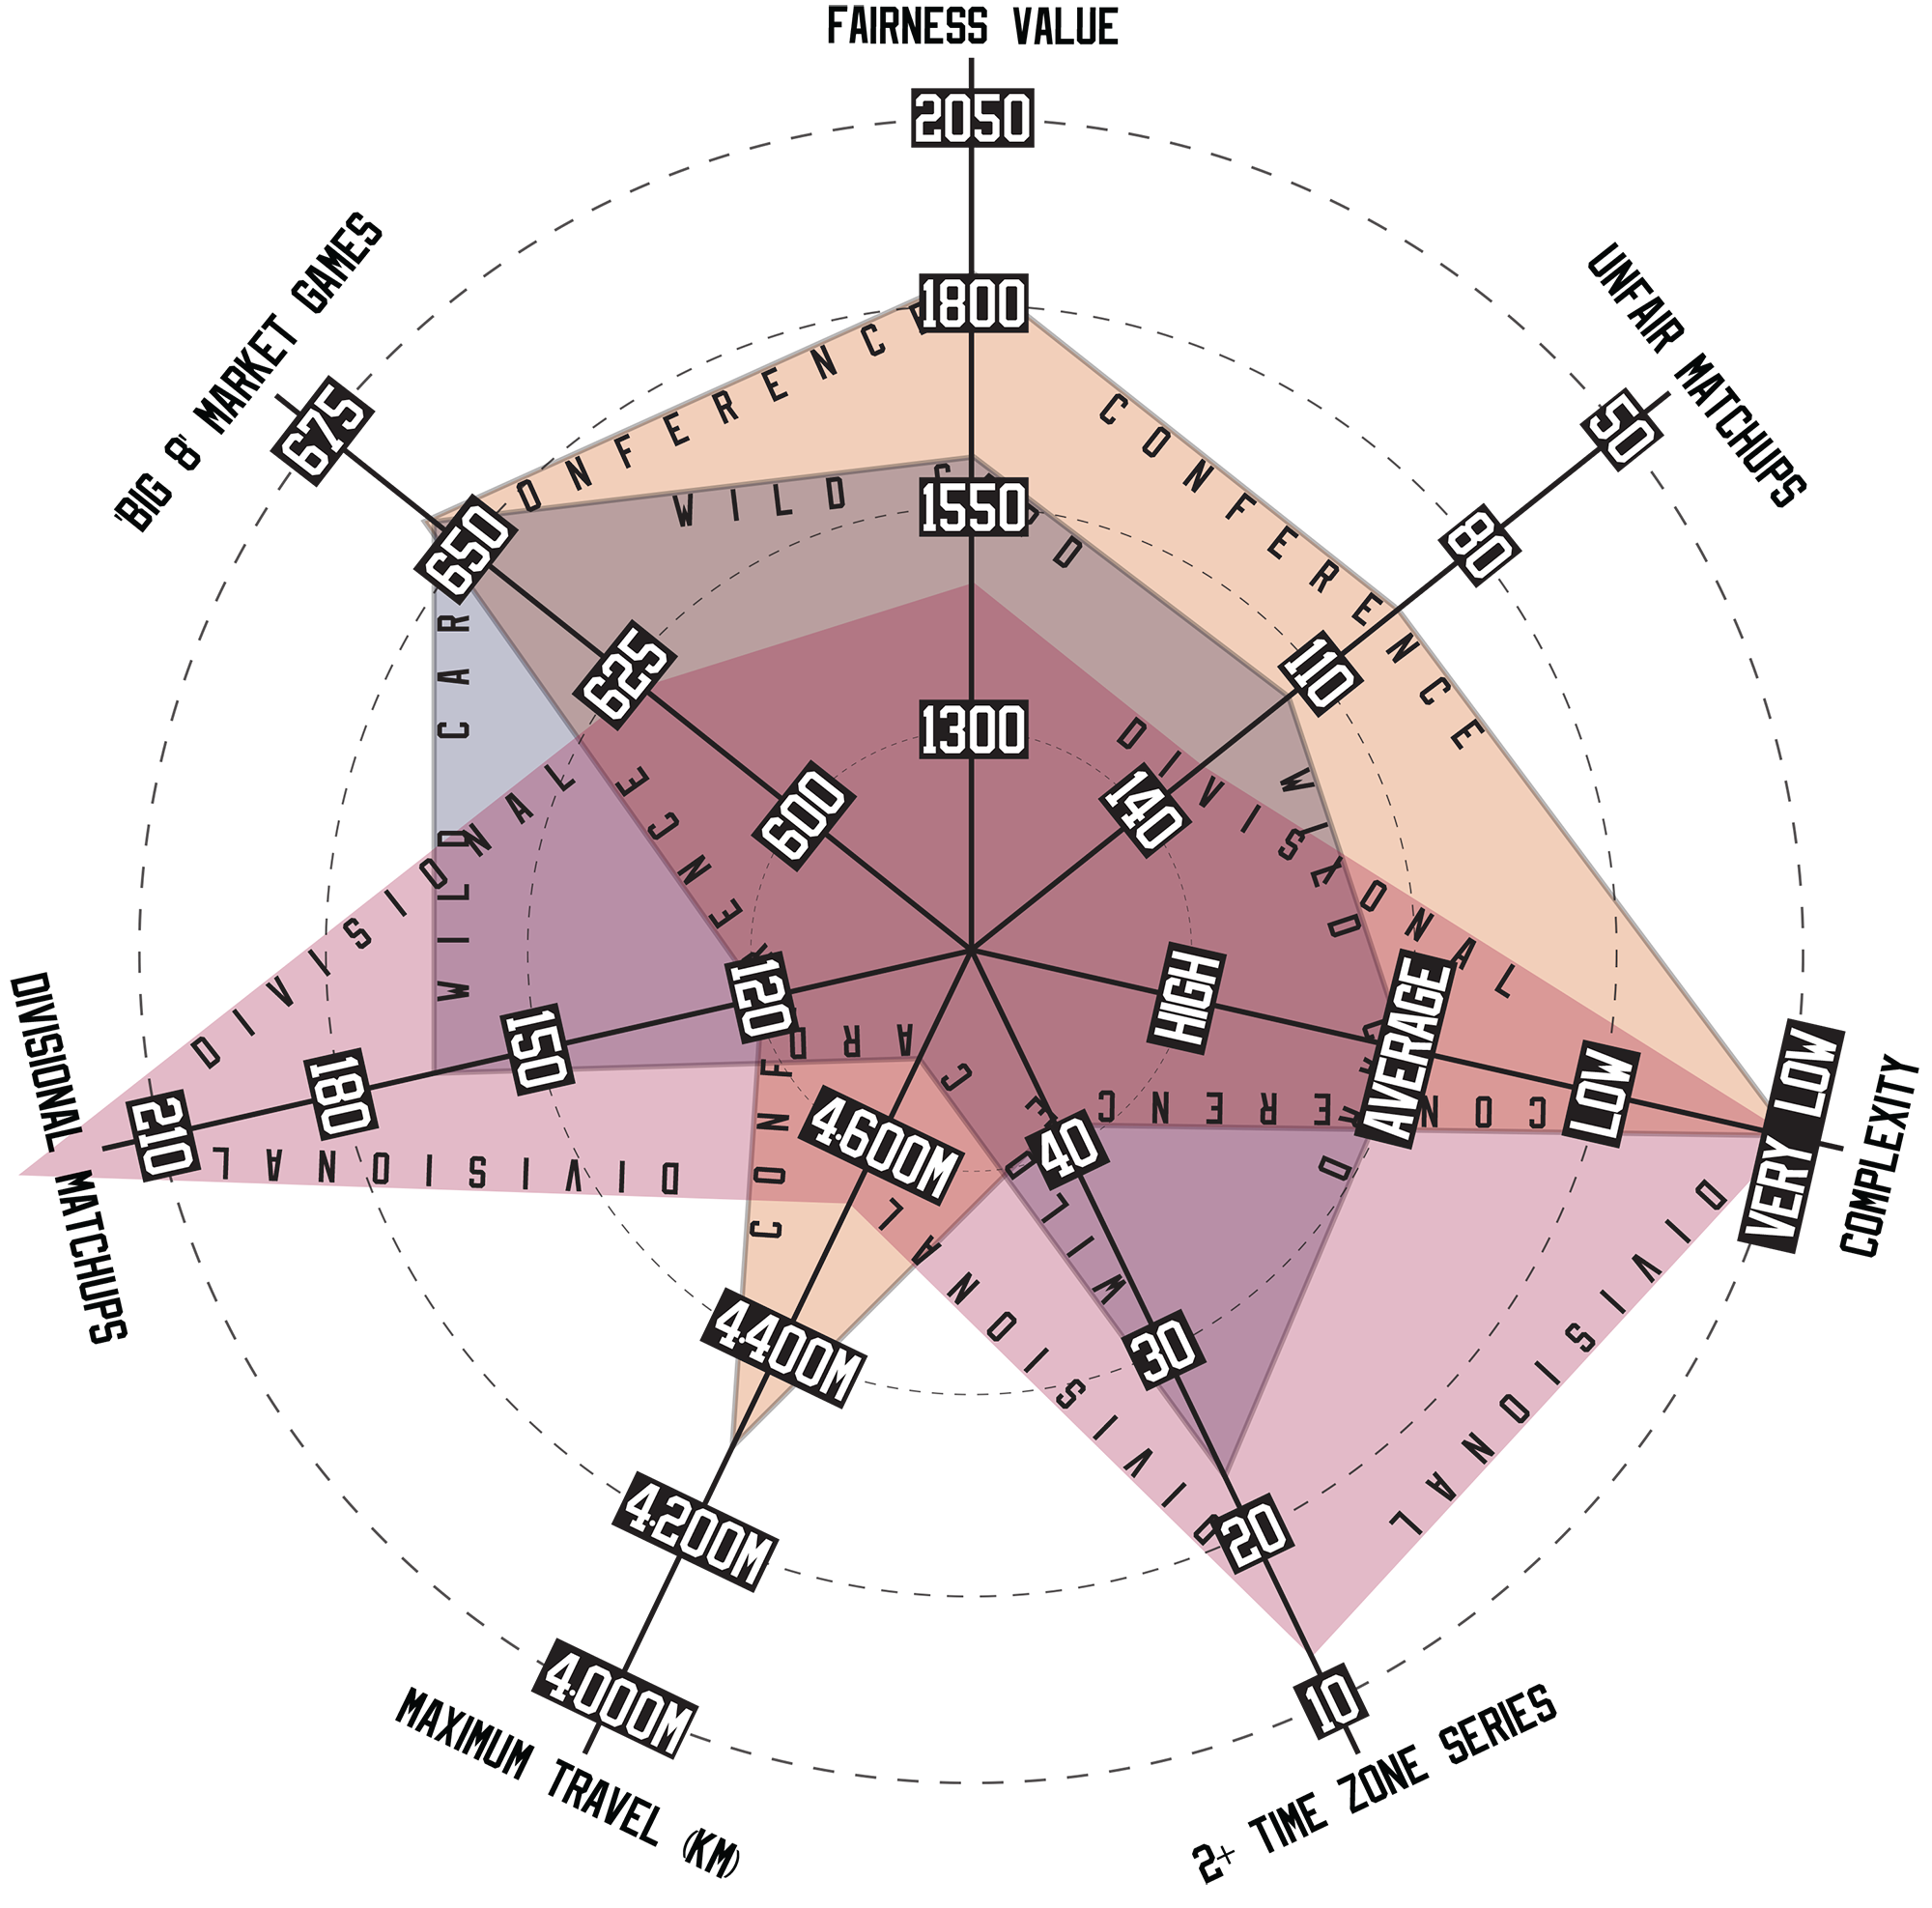
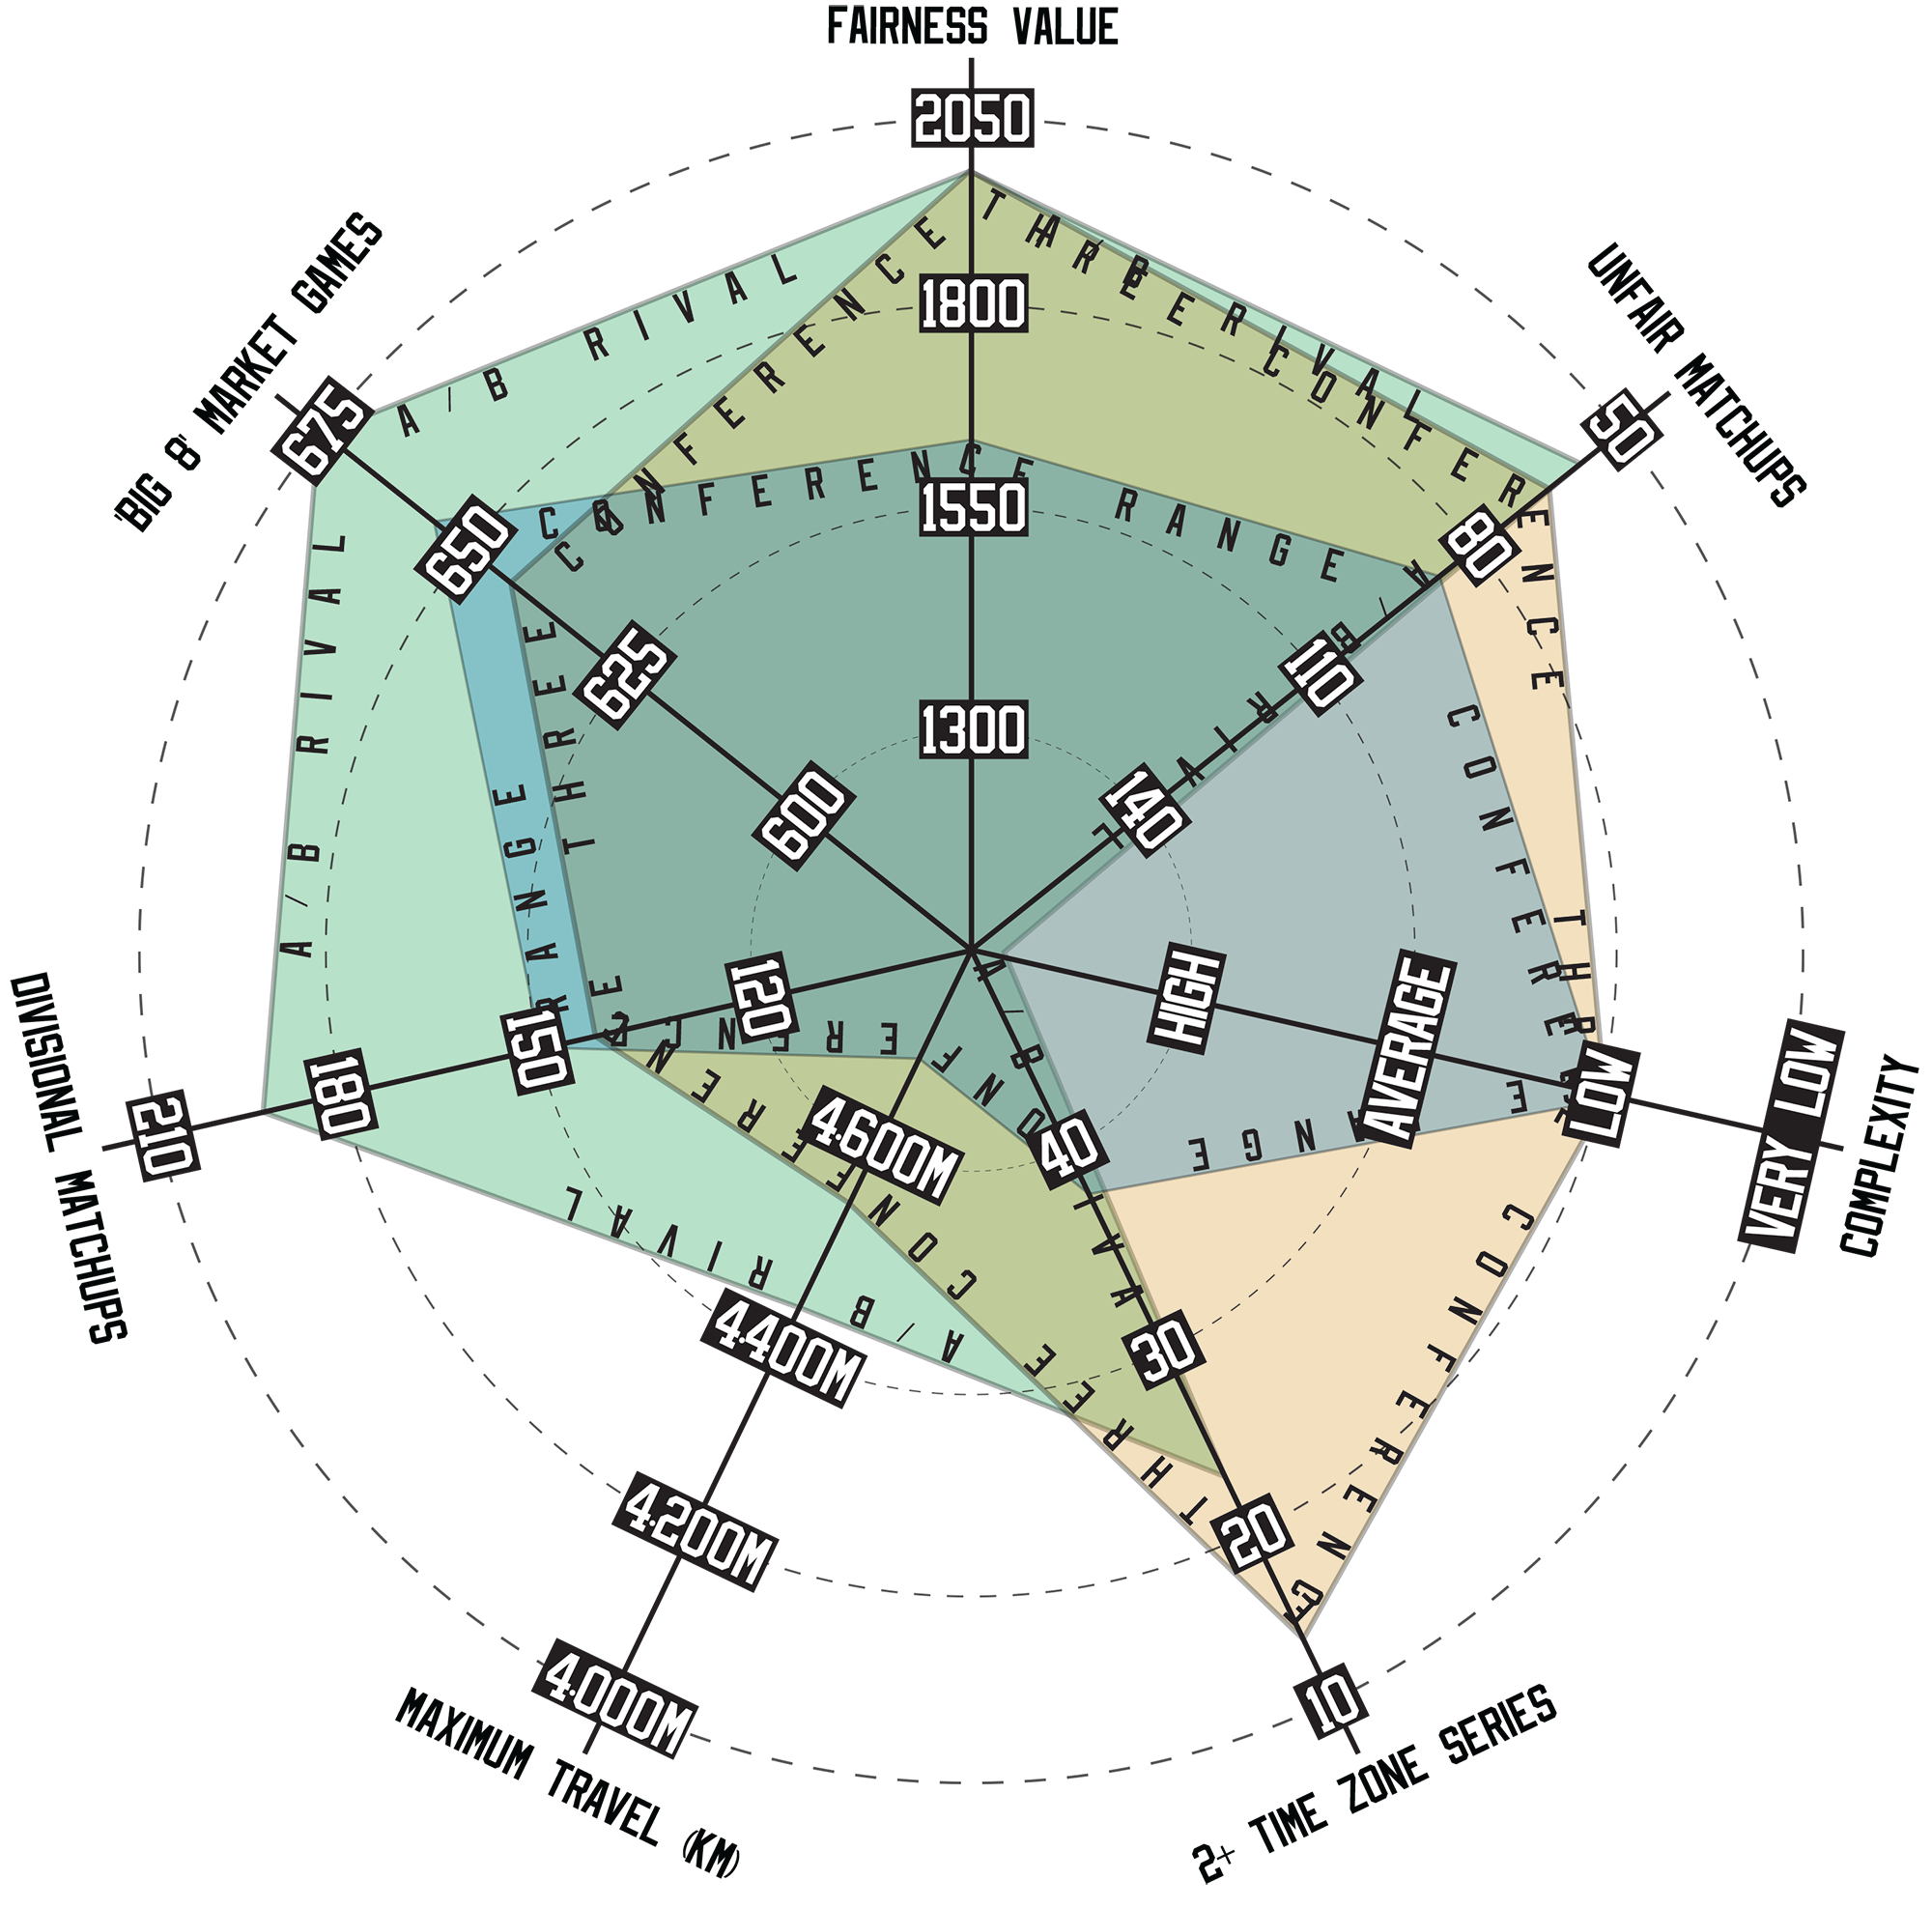
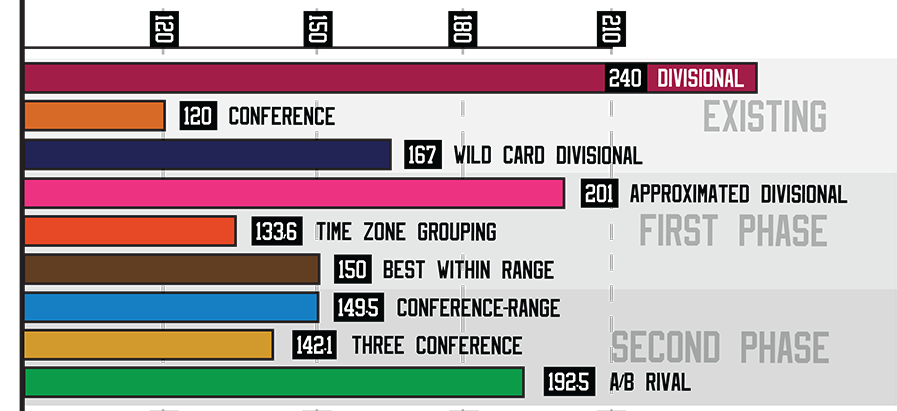
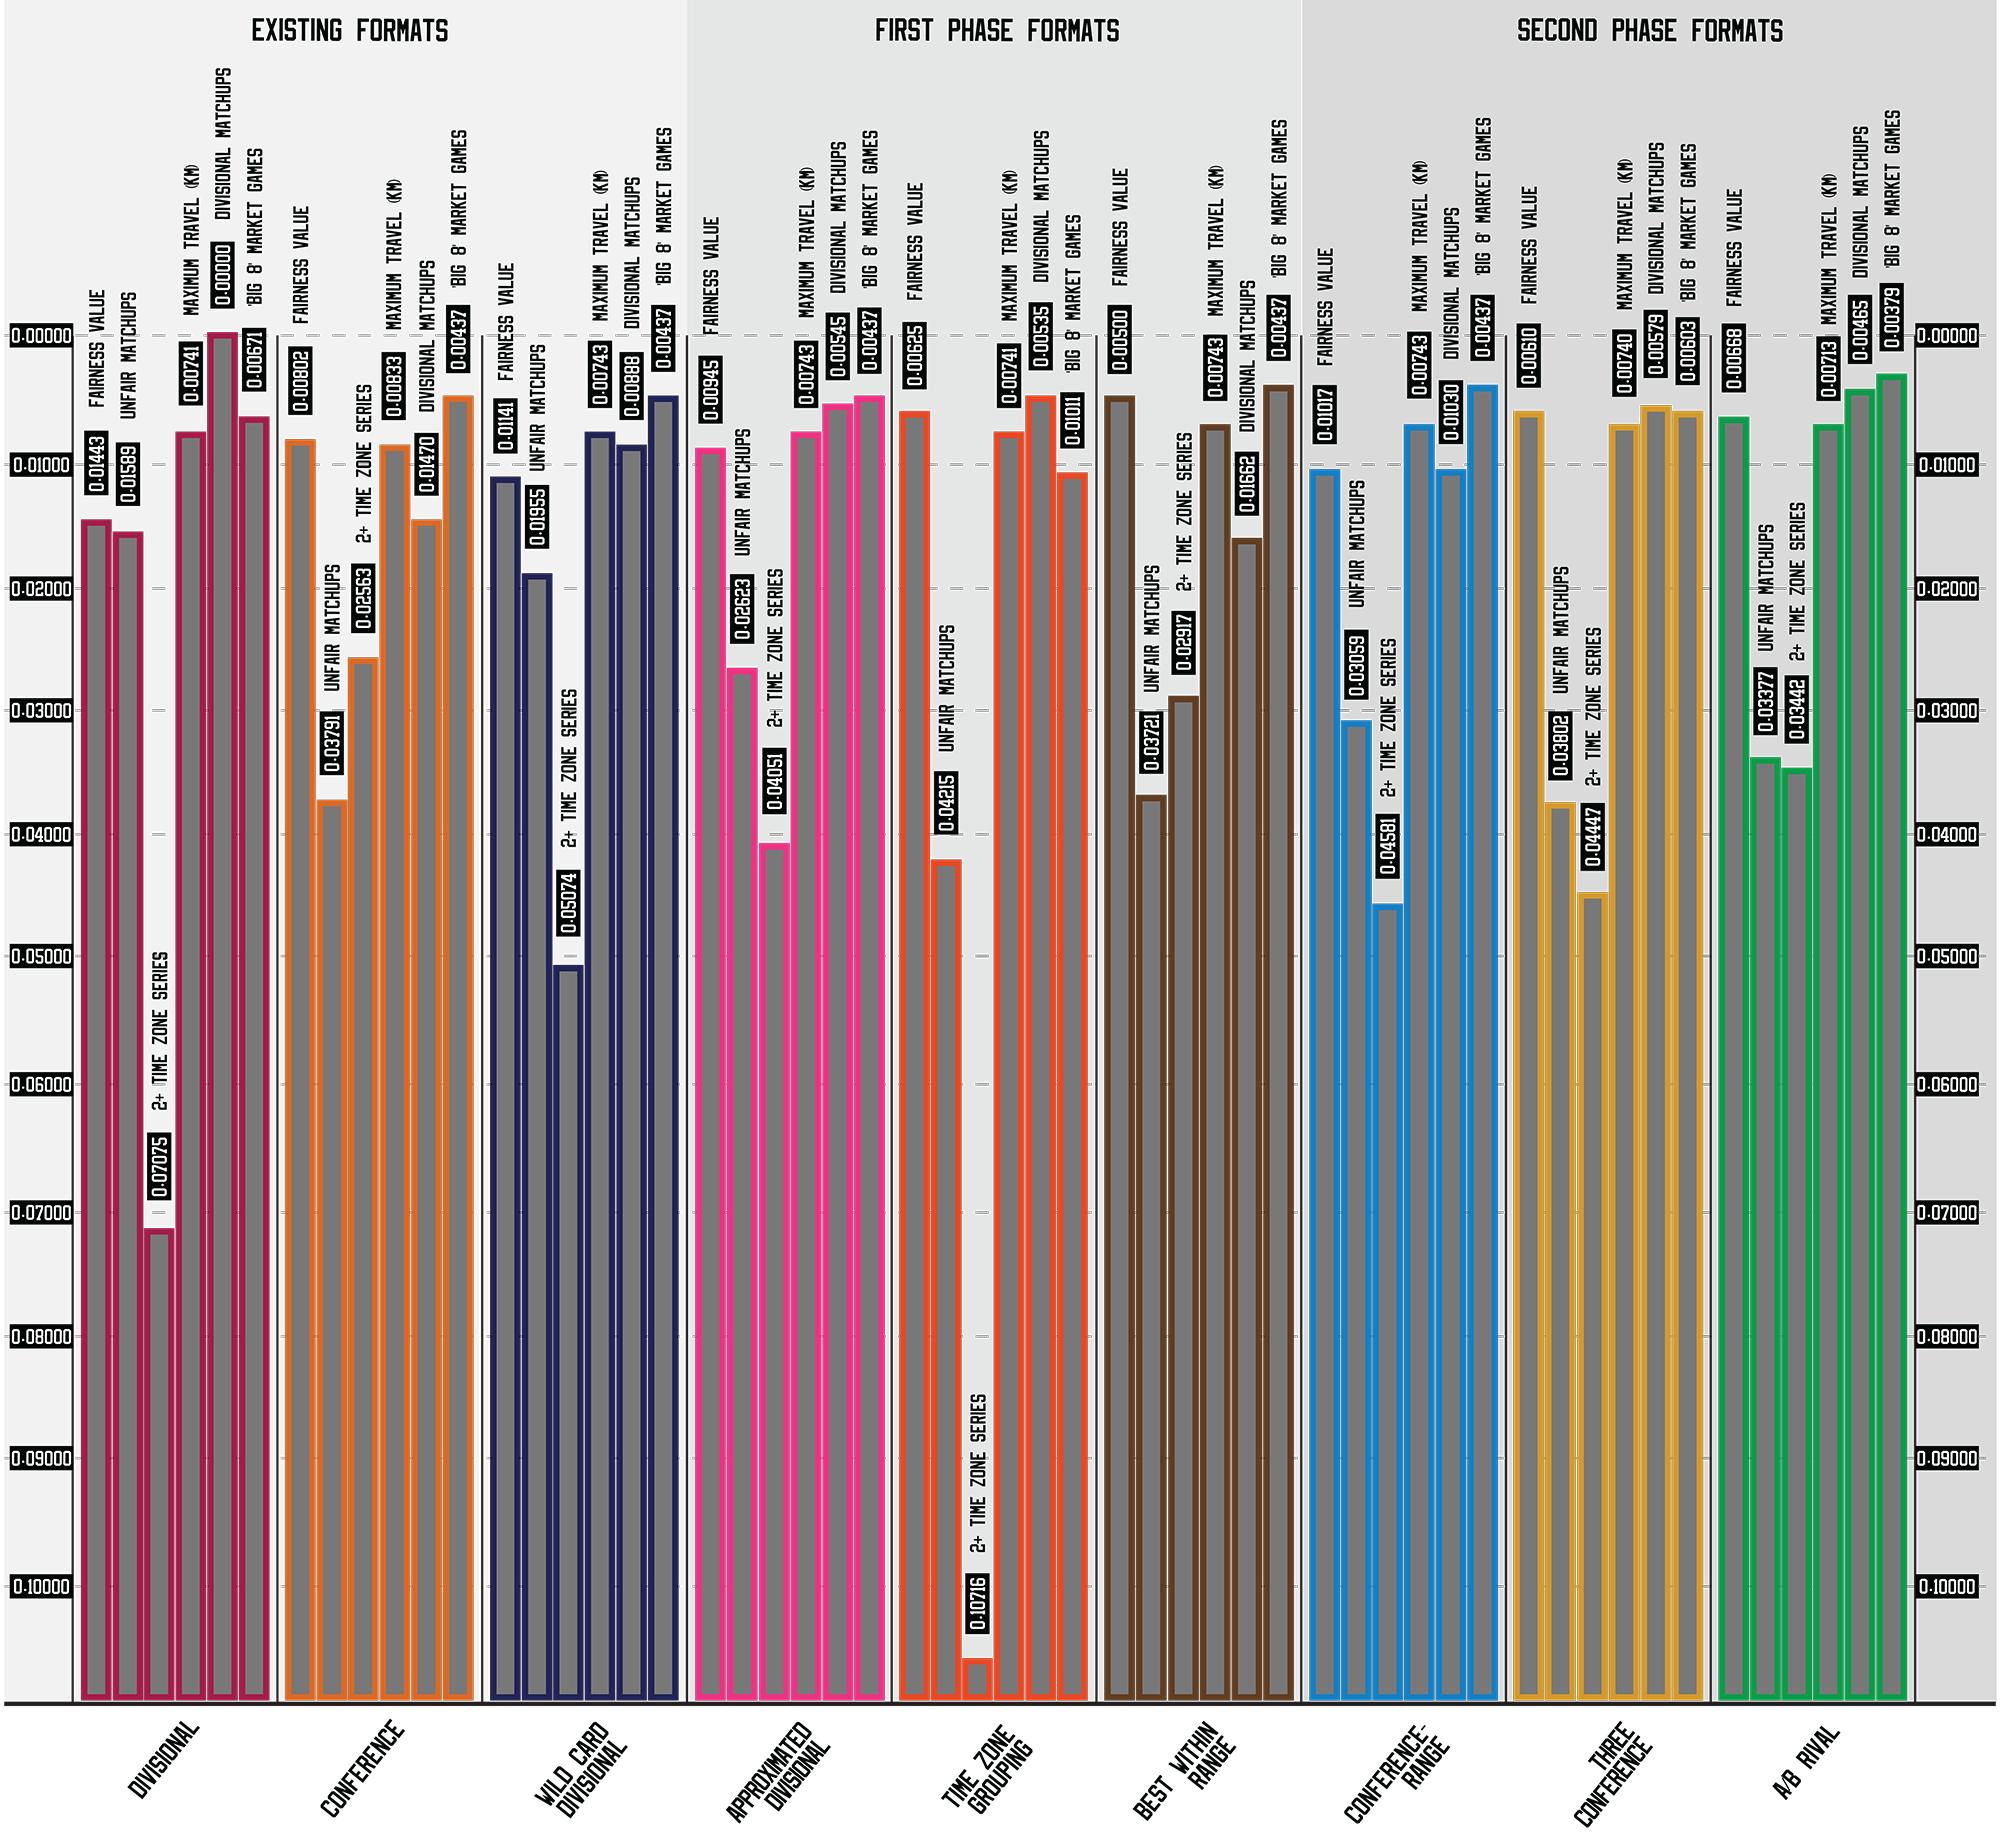
Instead, I opted to calculate the theoretical maximum total travel for each team, by adding together the distance between the team’s city and every other city, multiplied by how many times the two teams play each other in each format. The idea is that if the maximum amount of travel possible is less in one format than the other, then it indicates a positive effect on geographic alignment, and would be easier to schedule with less travel compared to other formats. The numbers recorded in the above chart are in millions of kilometres.
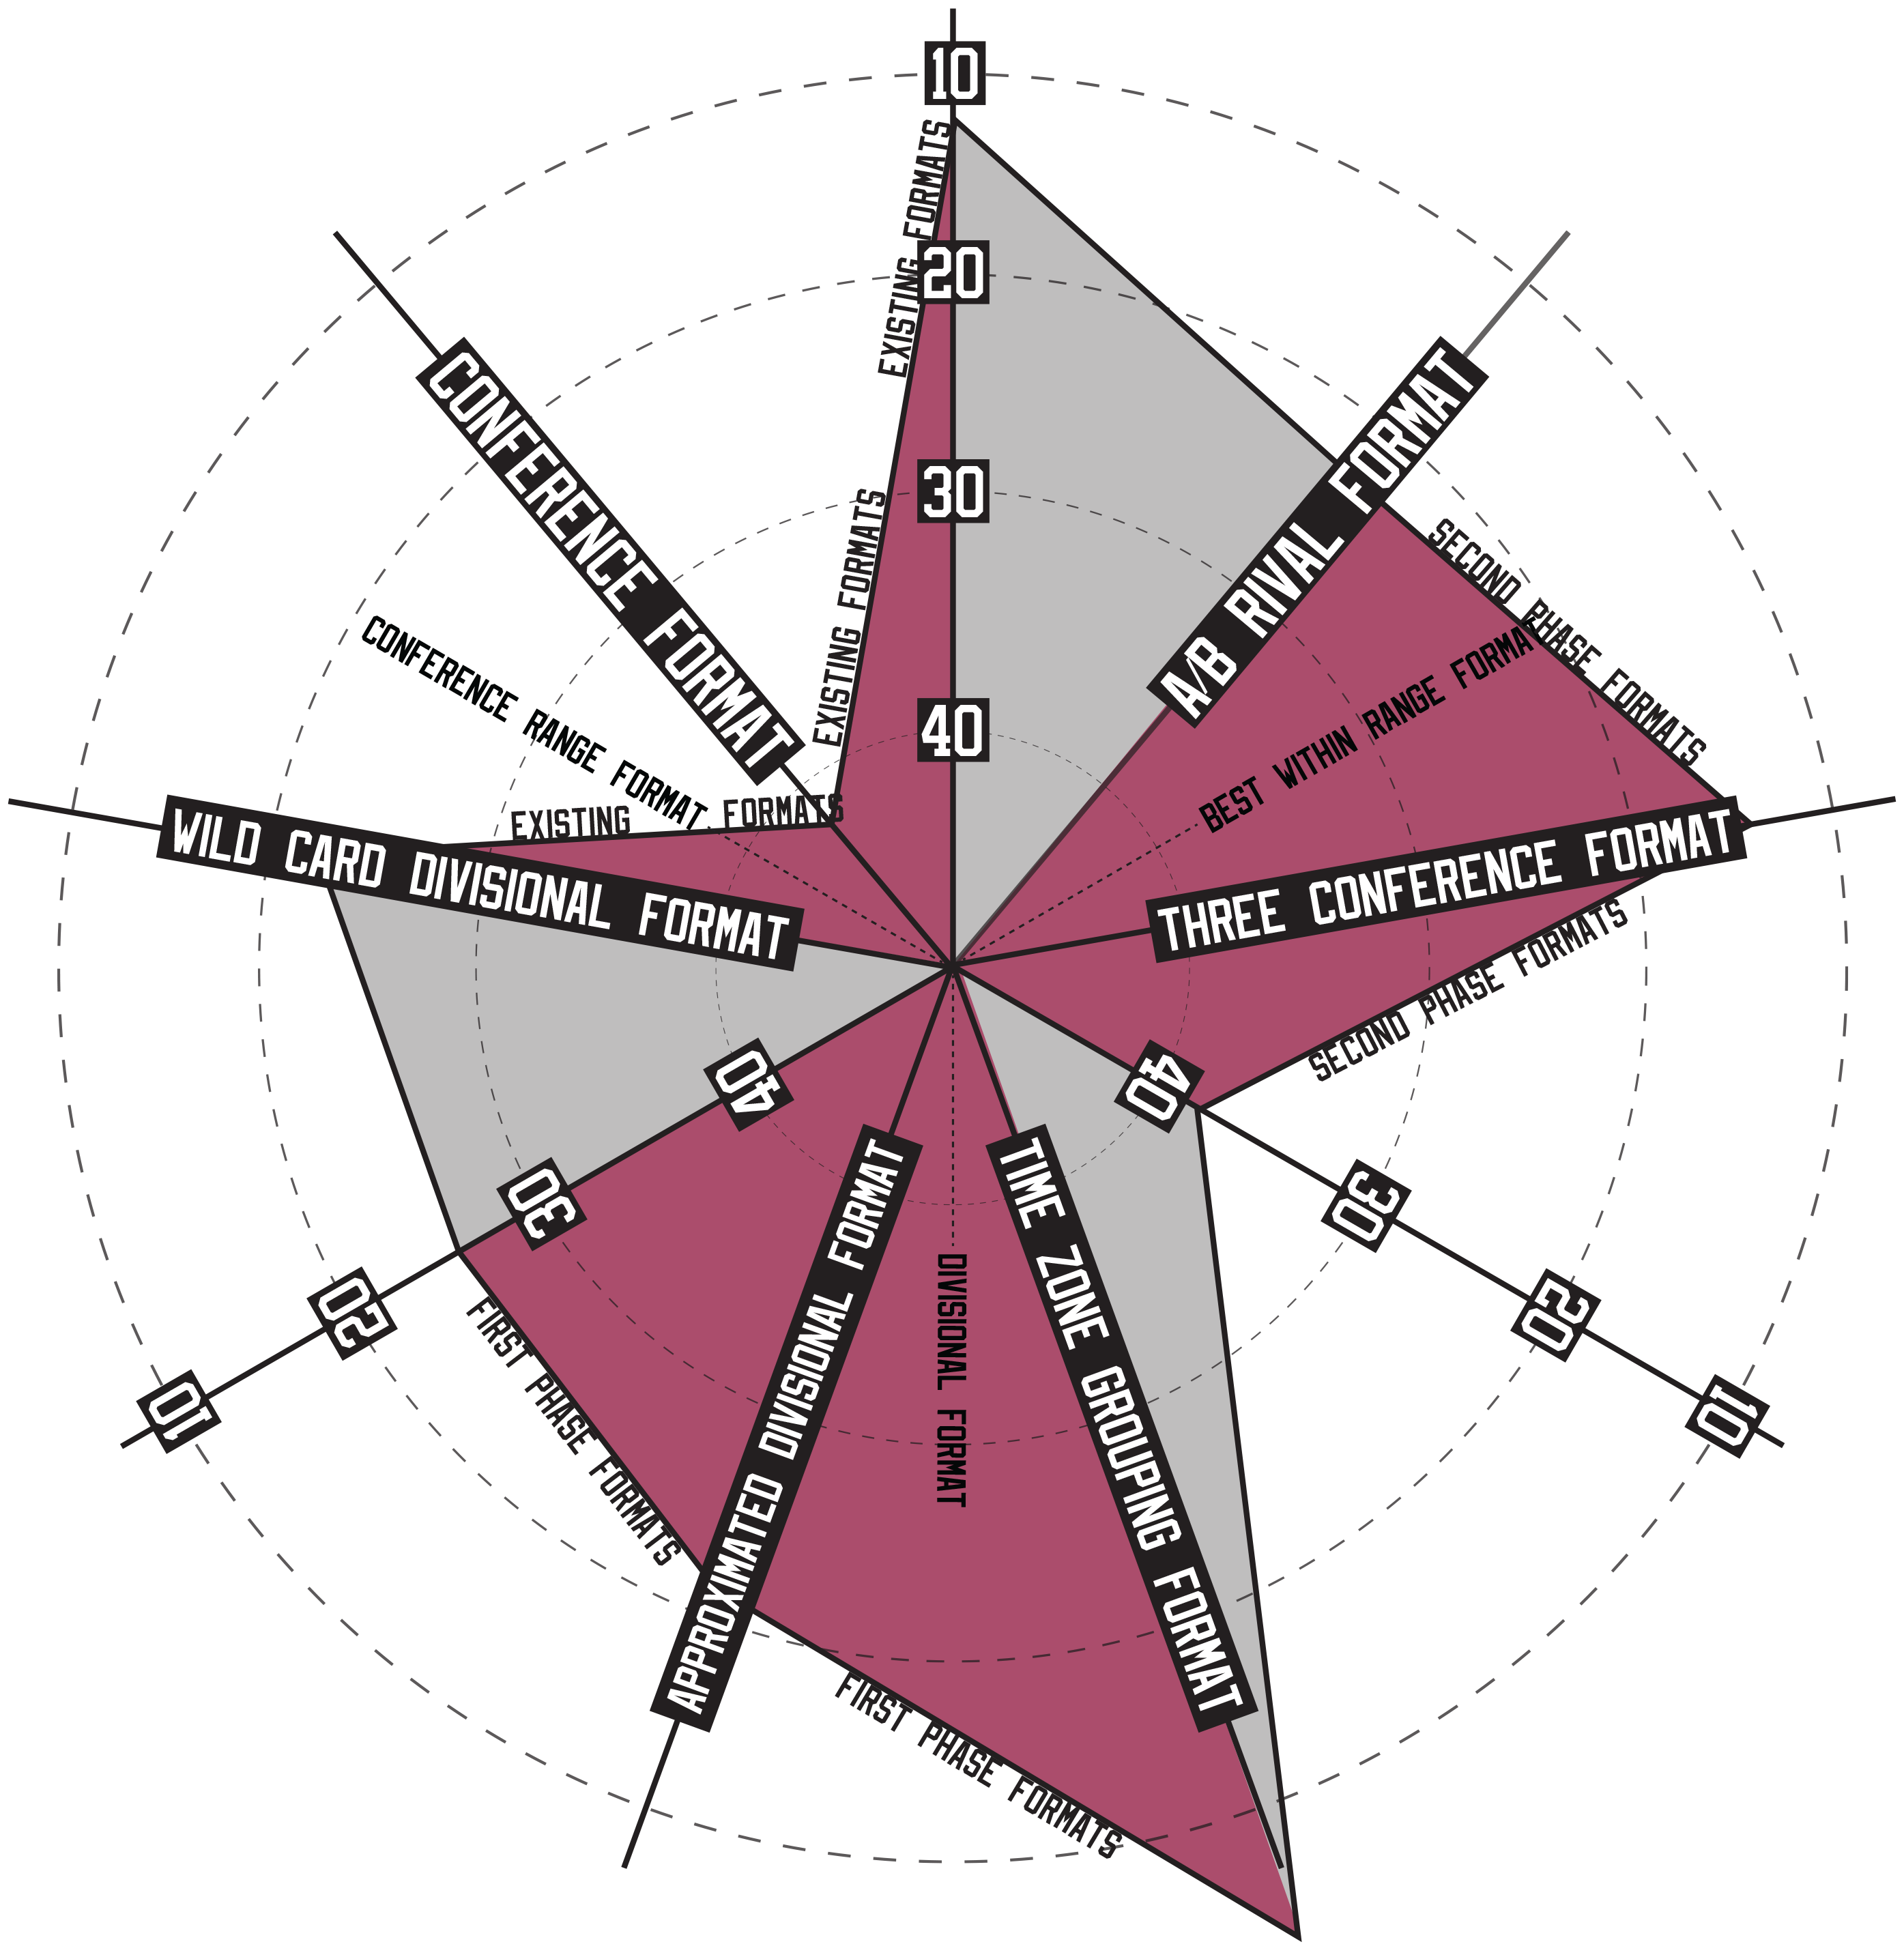
For time zone travel, I recorded the number of playoff series that occurred in the first two rounds involving teams that are more than two time zones apart, since after two rounds, especially in the Western Conference, it is normal that such matchups will occur frequently since only 4 teams remain, and the league’s geography is relatively spread out.
High time zone travel specifically in the first two rounds, thus, is considered a negative statistic for each playoff format. The numbers in the above chart are 2+ time zone series in the first two rounds per 20 seasons on average, so a format that has ’40’ averages about 2 high time zone series in the first two rounds per season, while a format scoring ’20’ averages 1 high time zone series in the first two rounds per season.
Rivalry Building & Sustaining
 The existence of rivalries in the NHL cannot truly be empirically validated, as rivals are not necessarily tied to being in the same division or conference, or the age of a franchise, or the frequency of playoff matchups between teams (guided by the format or not).
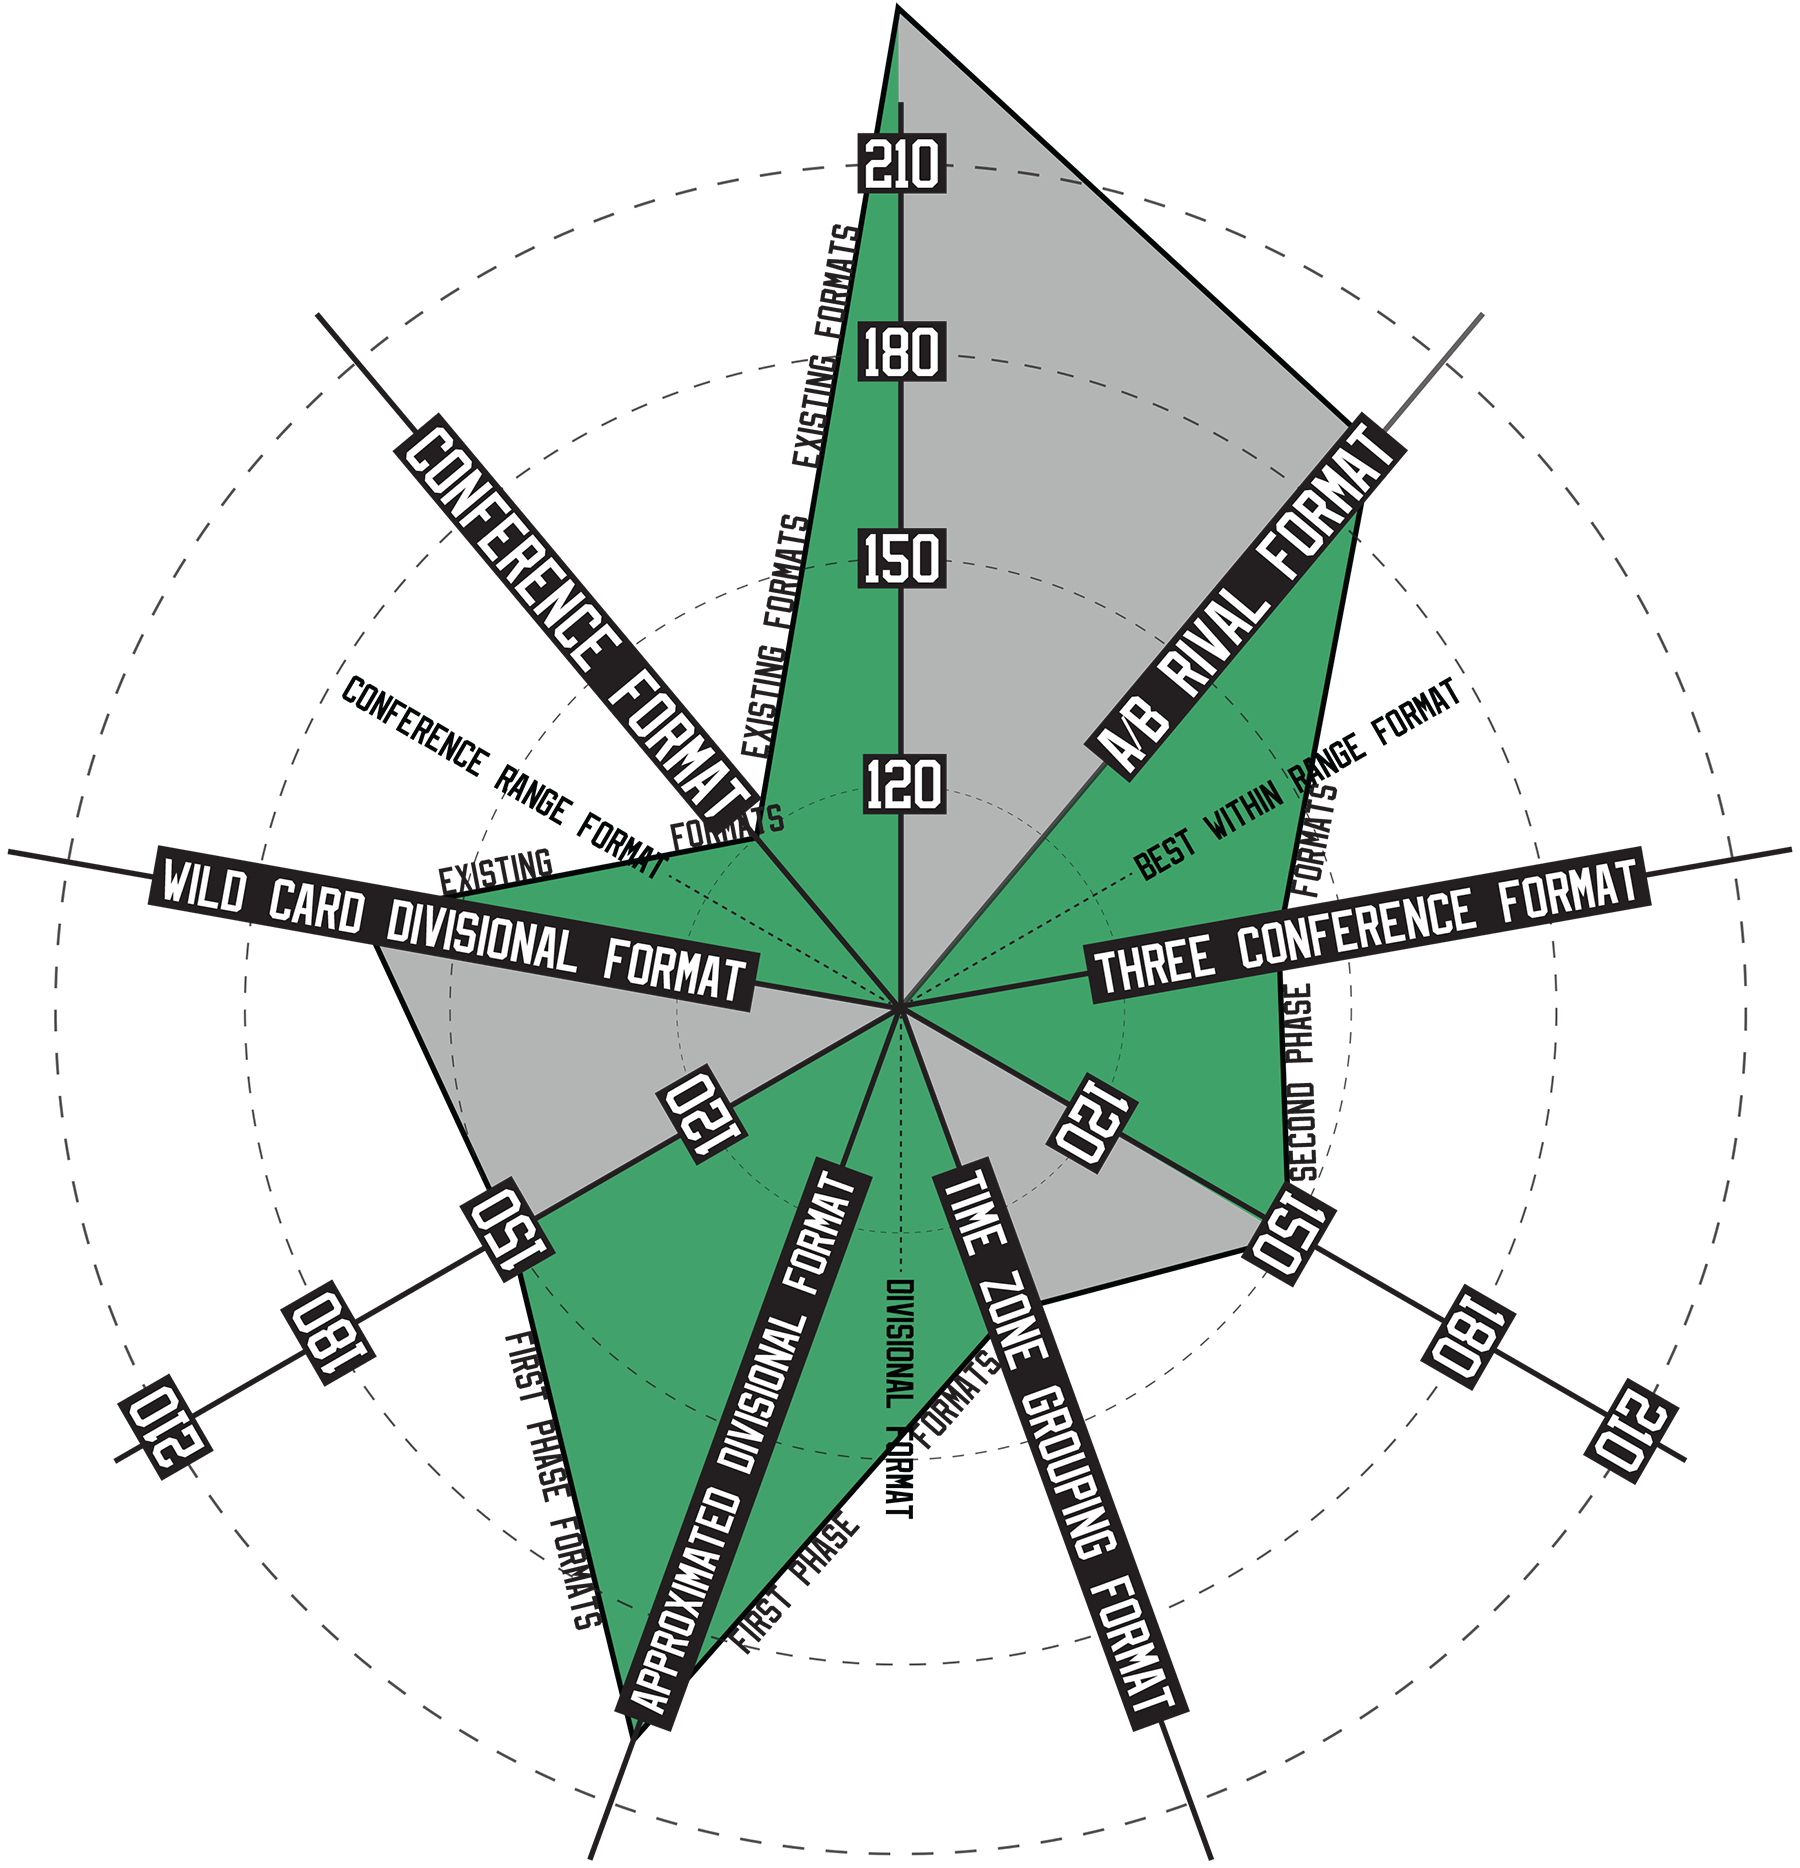
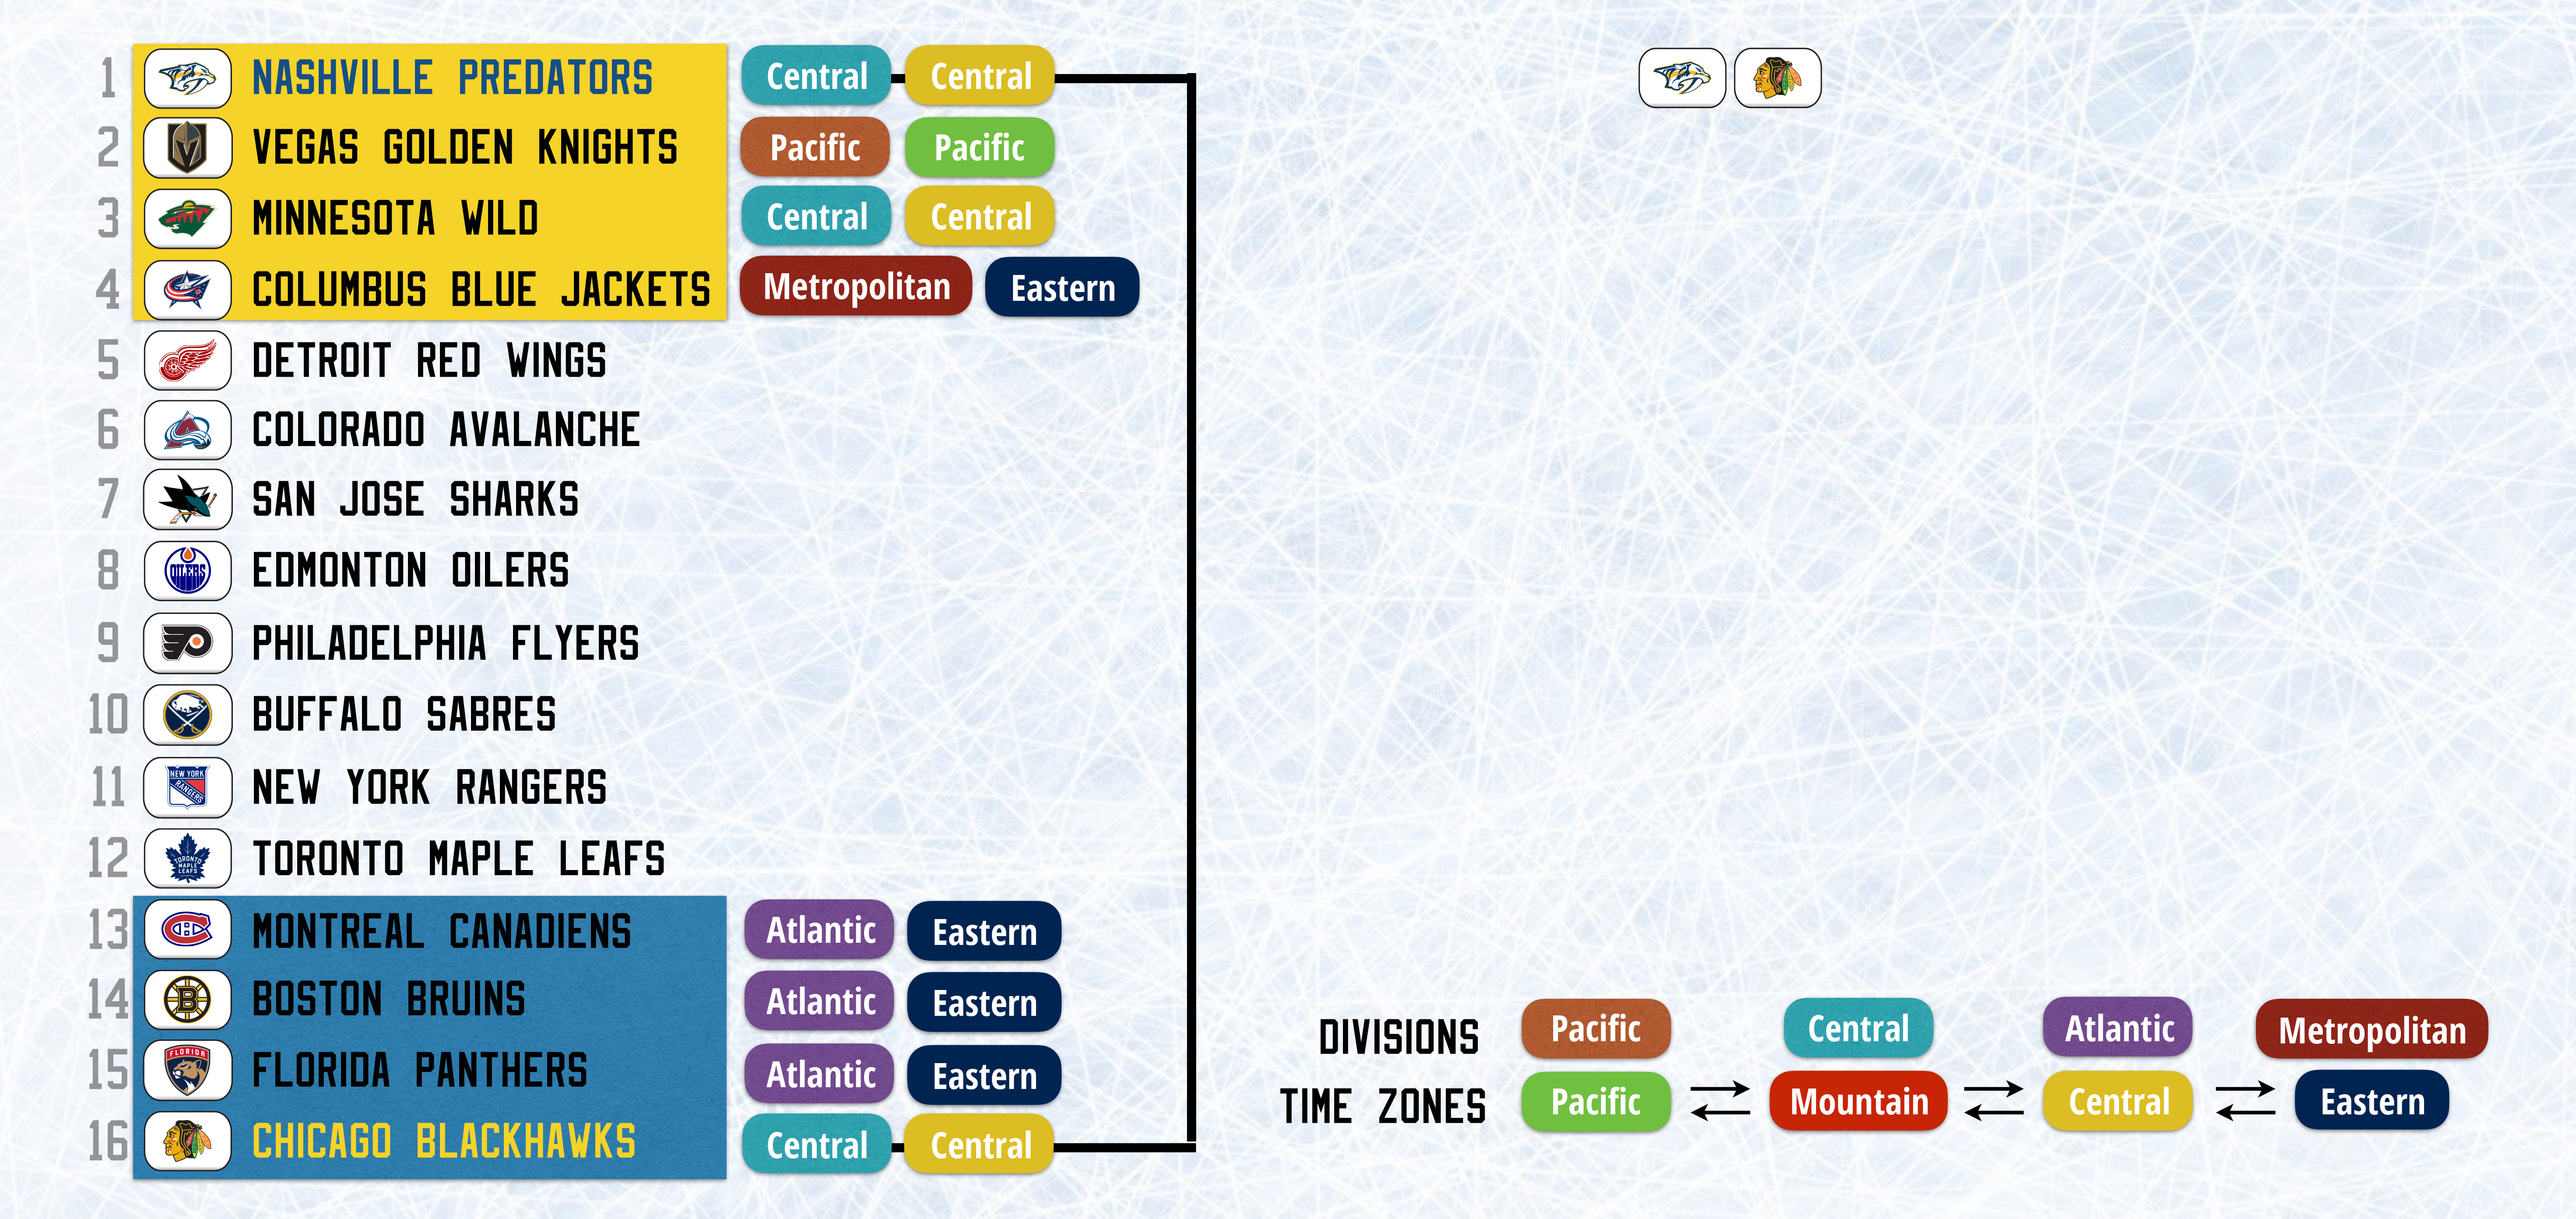
However, it is worthwhile to positively validate a format if it provides more playoff series between teams from the same “division”, as that is the closest measure to a “rivalry indicator” that exists and is clearly considered a positive trait for a playoff format by the NHL (as indicated by their move to a semi-Divisional format from a Conference format).
Not every format has “divisions” at all, or ones that contain the same number of teams, but they all have differences in the frequency at which teams play games against each other in the regular season, so that represents the designation of “division rival” in this context. These numbers of “divisional” playoff series are adjusted to a ratio that reflects the same number of “division rivals”, even when that number differs between formats, in order to make them directly comparable to one another. For example, in the Three Conference Format, every team has either 9 or 10 “division rivals”, while most other formats (Divisional, Conference-Range, A/B Rival) have 7 “division rivals” per team. Thus, the total is adjusted to a scale equivalent to having 7 “division rivals”.
As with the time zone travel numbers, I restricted this measure to only the first two playoff rounds, since beyond these rounds, there are few teams remaining, and so non-“divisional” series are to be expected, and the only effect on “divisional” matchups that a playoff format can have at this point is making it more likely that not that if “division” rivals happen to be among the remaining teams, which is rare, that they are more likely to play each other than not. Once again, the numbers in this chart reflect an average per 20 season sample size, so a format scoring ‘150’ averages 7.5 “divisional” series in the first two rounds per season, which is out of a maximum of 12 (8 series in the first round, 4 in the second).
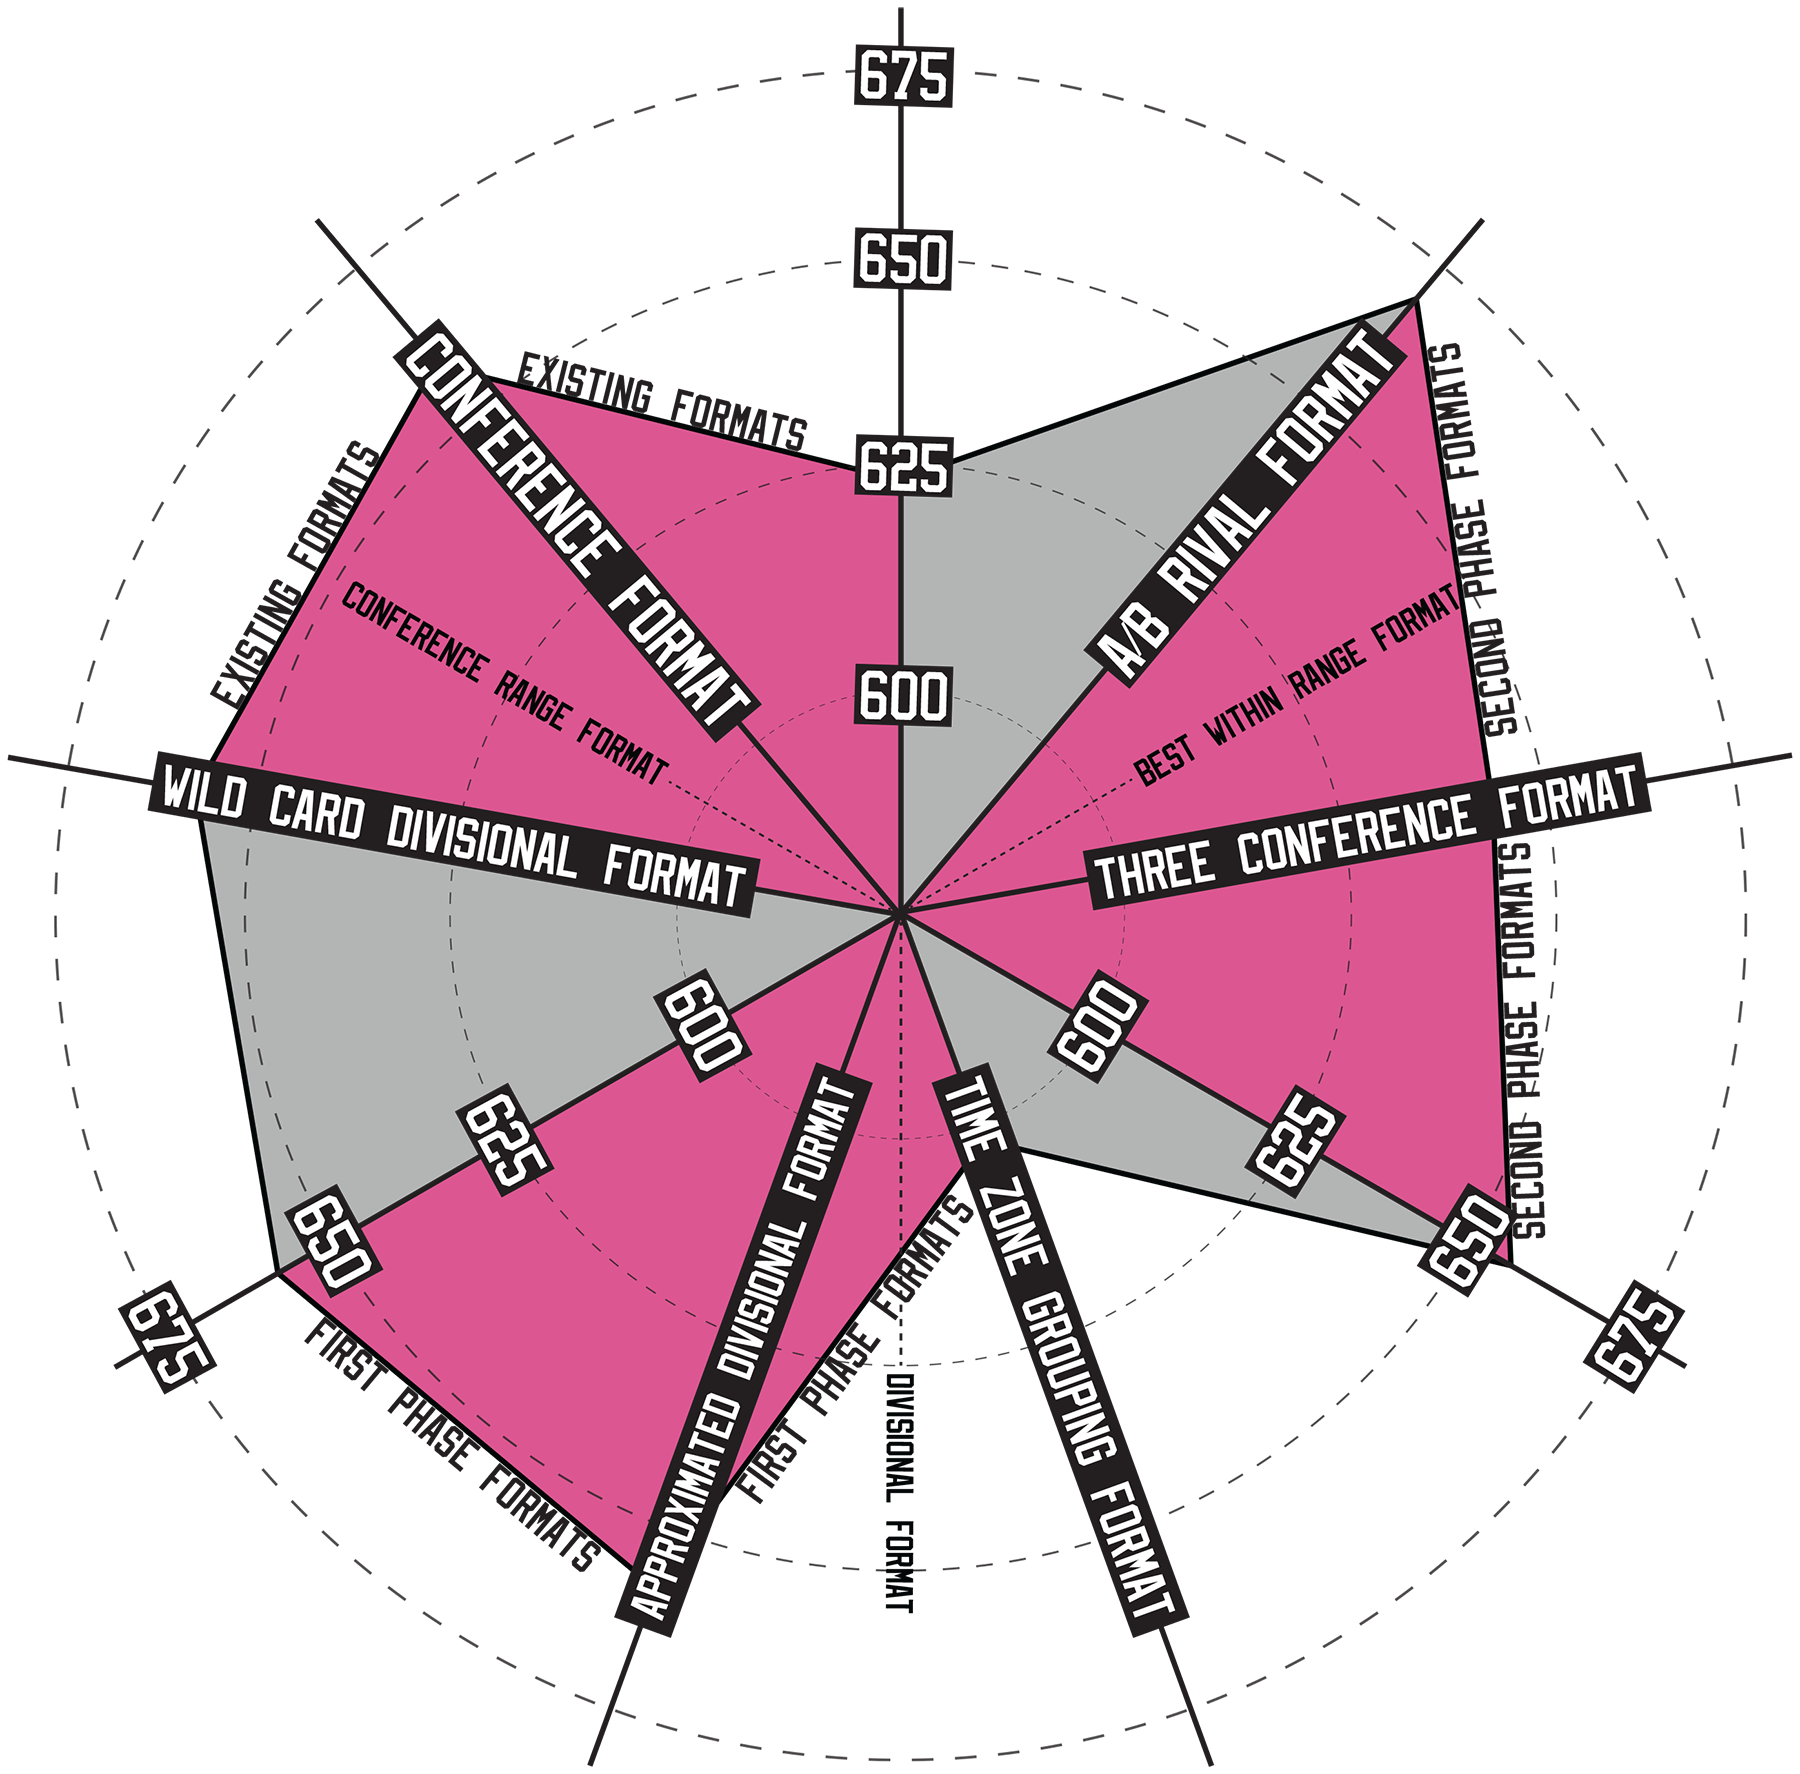
 Assessing market support necessitates keeping track and measuring the degree to which the “Big 8” markets (Boston, Chicago, Detroit, Los Angeles, Montreal, New York Rangers, Philadelphia, Toronto) are distributed among all others.
Rather than applying to the playoffs, this measurement applies to the regular season, since the number of regular season games the other 24 teams are allowed to play against the Big 8, so long as the playoff format mimics the regular season schedule in terms of likelihood to meet each team, indicates how well these markets are distributed. The resulting numbers are games per season against Big 8 markets.
Fairness
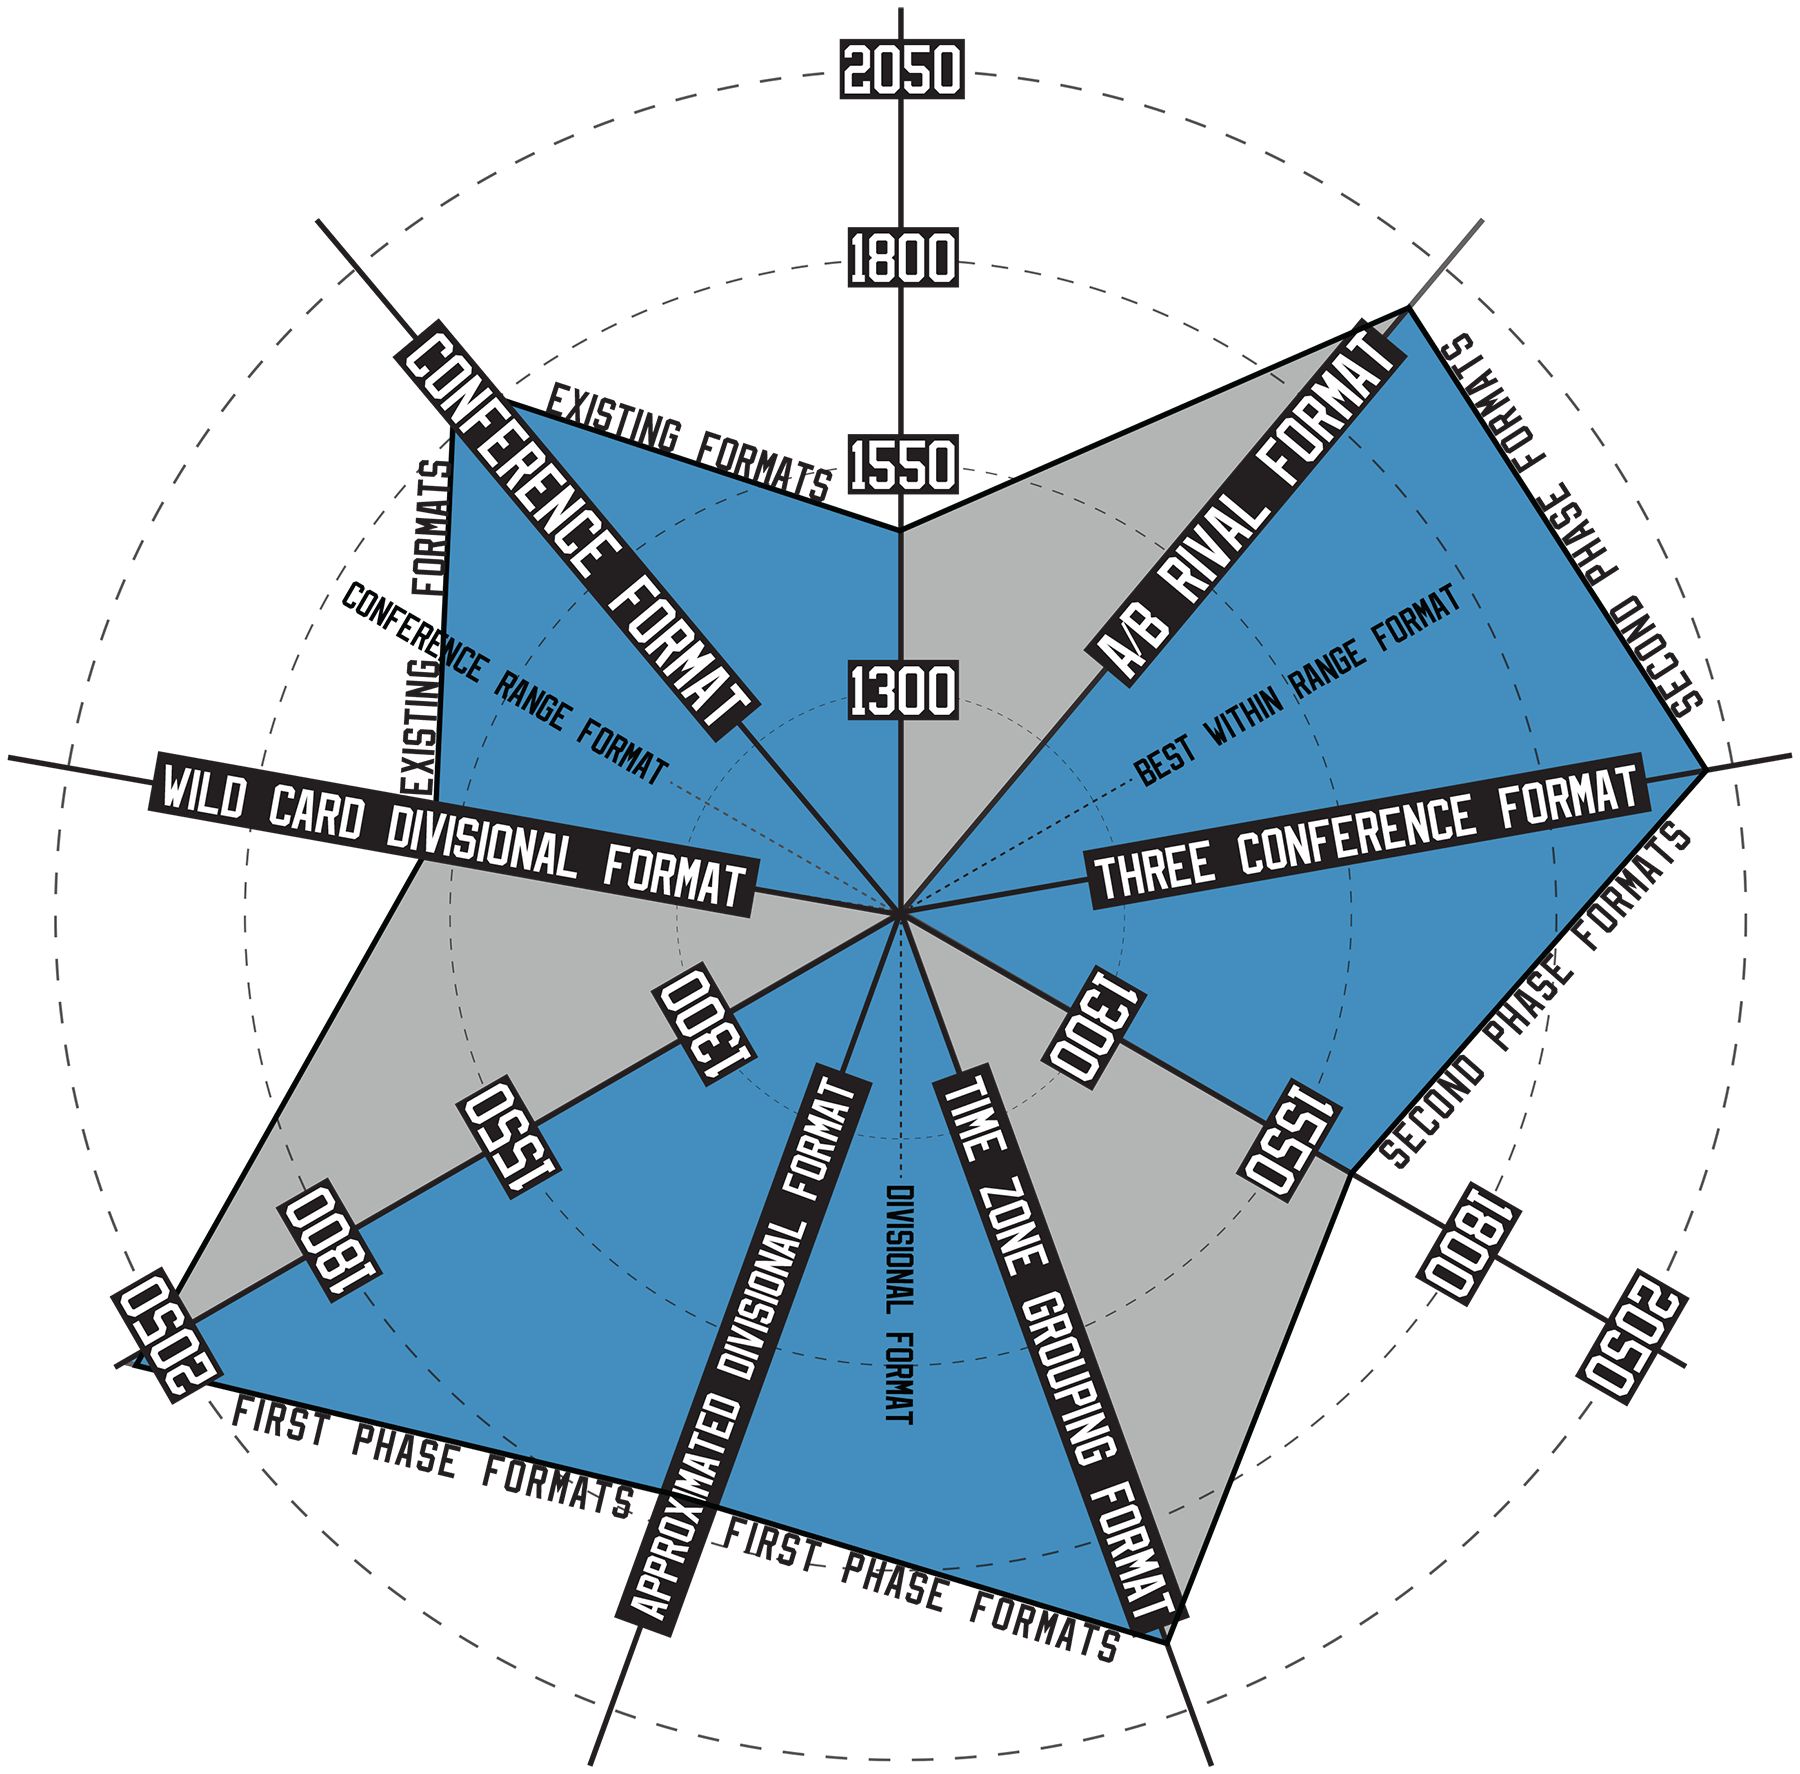
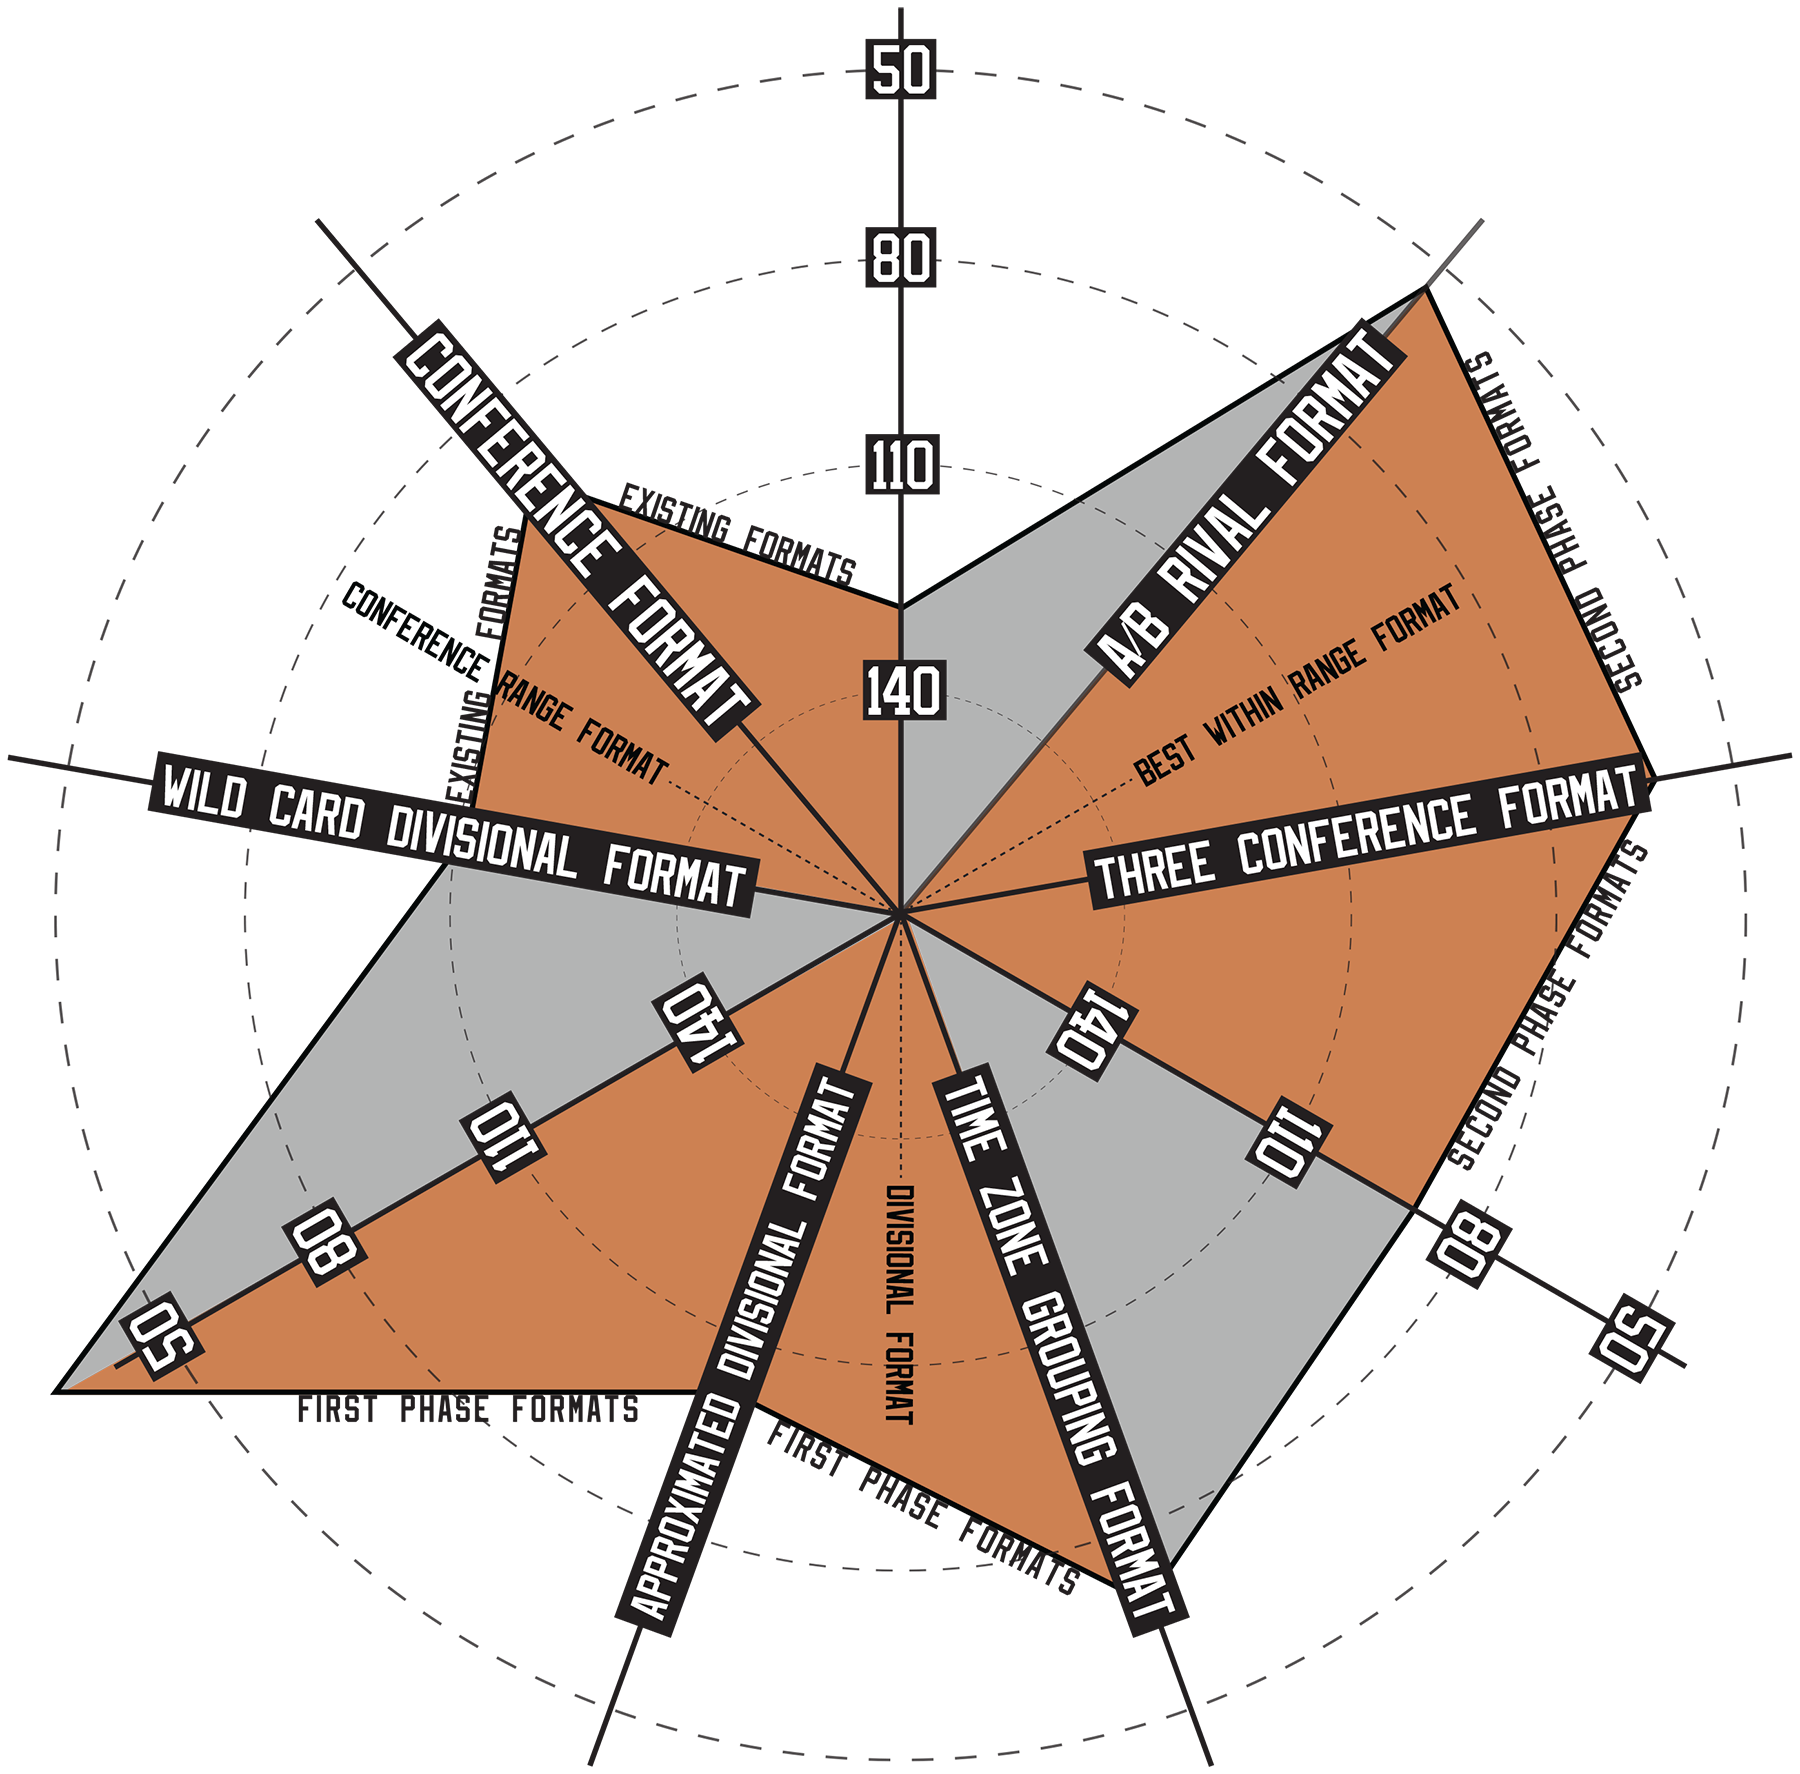
 My attempt to empirically validate fairness in a playoff format is to take each playoff series that occurs in each playoff year in my simulations, subtract the position of the higher team in league-wide standings from the lower team’s position (ex: if the #14 and #5 teams league-wide play a series, this counts as “9”) and add these numbers together to reach a total.
In a format with only 16 teams able to make the playoffs, I consider teams lower than #16 making the playoffs a negative value towards fairness, so when this occurs, I double the difference between the team’s position and the #16 spot and subtract this number from the fairness total (ex: if there is a matchup involving a team that is in 19th place that made the playoffs, I subtract 6 from my total afterwards, because this team finished 3 spots below #16).
I double the number because only subtracting the difference in position treats each team that finishes lower than #16 as if they were #16, rather than actually negatively impacting the fairness value, and more so the lower the team finished (ex: a team that finished #17 will only subtract 2 points ([17-16]x2), but one that finished #22 would subtract 12 points ([22-16]x2)).
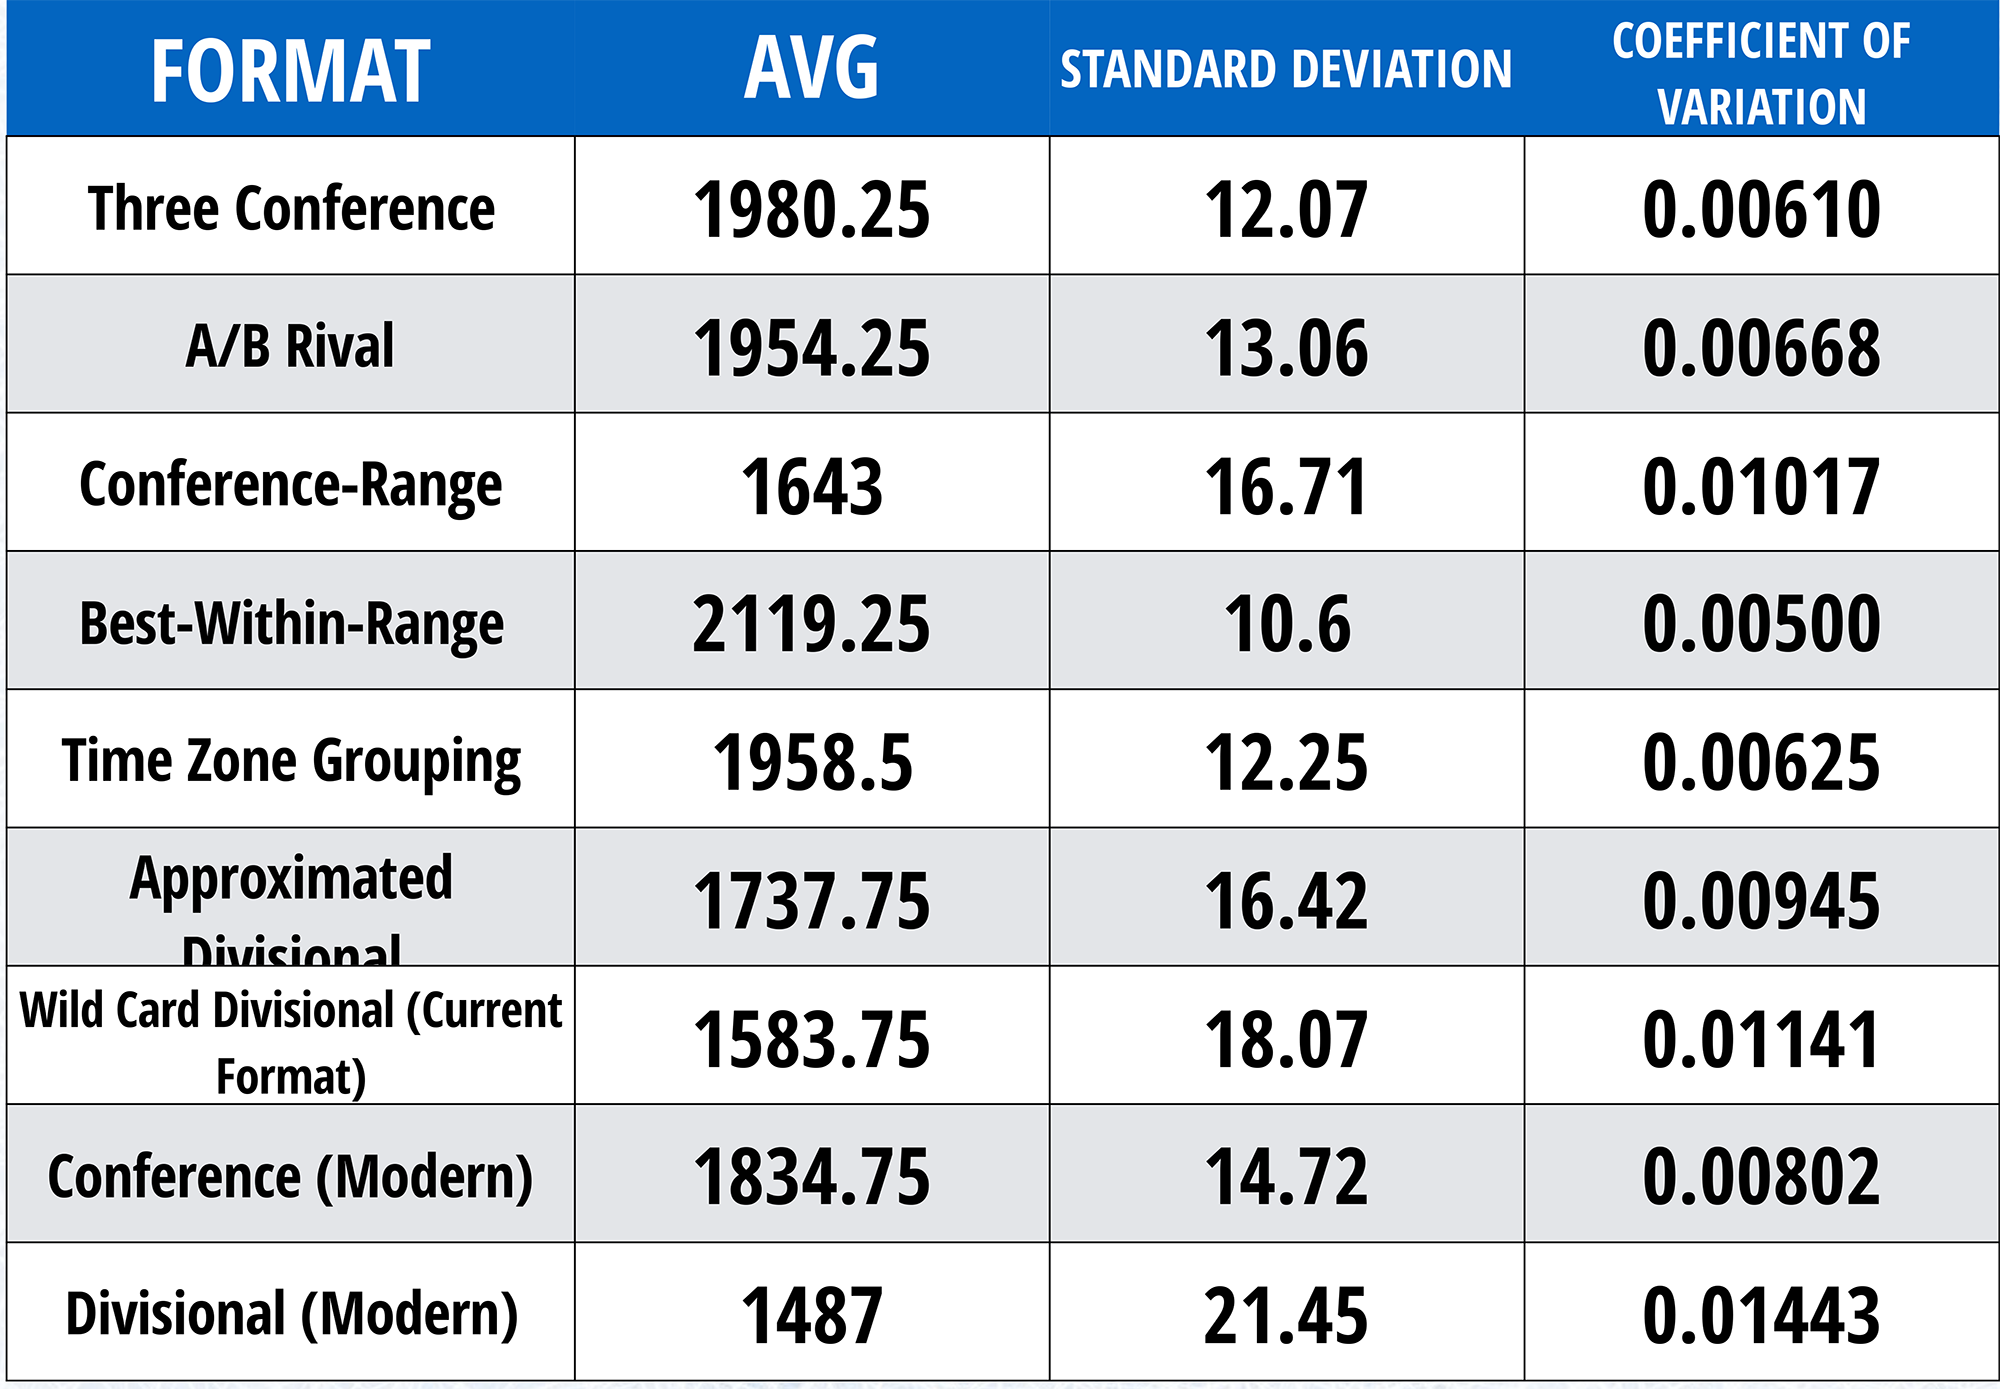
The result is a numerical value that can be said to represent the fairness of the playoff format. Because the comparability of these numbers to each other are so important for validation, this is the reason why I used the same four sets of randomized positions in the standings and numbers for each team to determine the winner of a series for every playoff format that was validated. The differences in the four reported fairness values of each format are thus primarily due to the format and not any other differentiating factor. The numbers in the chart above reflect the average fairness value per 20 season sample size; the best performing formats on fairness score around 1900, while the worse-performing formats are closer to 1500.

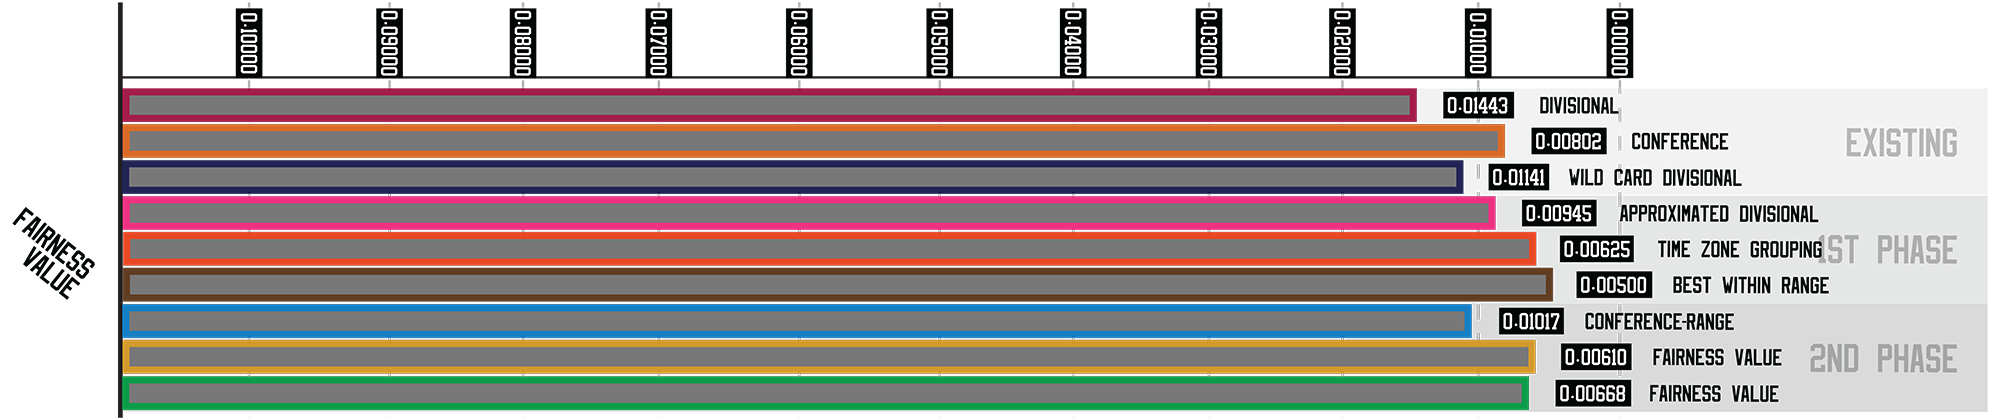
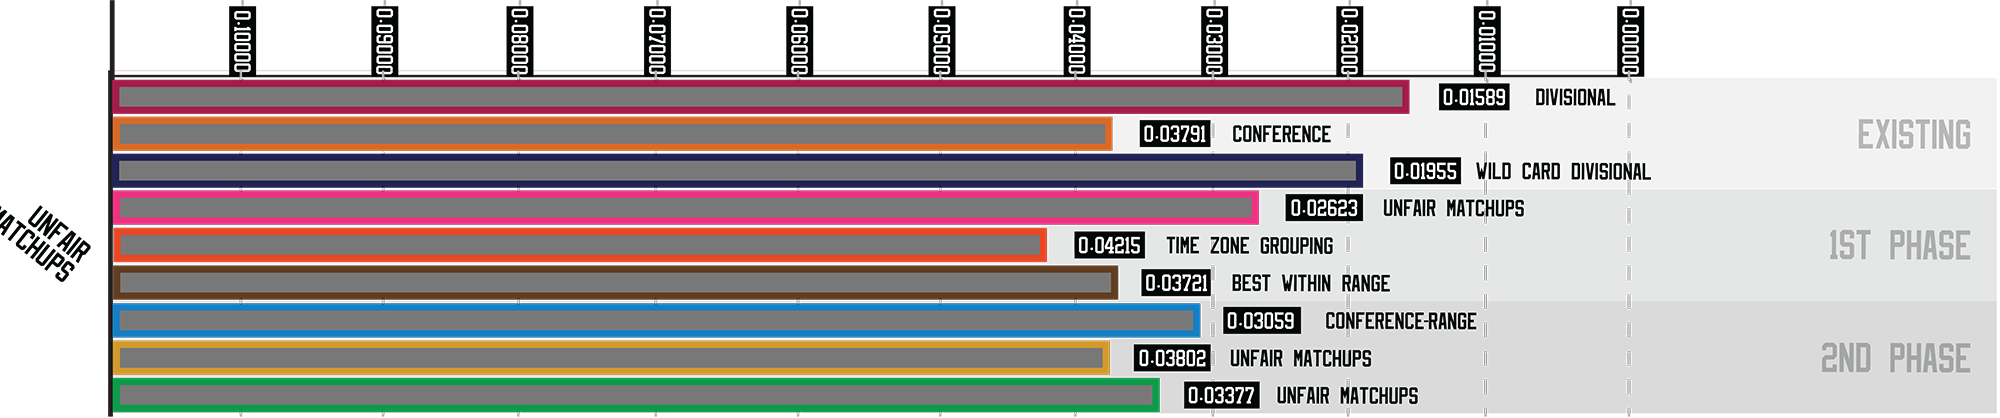
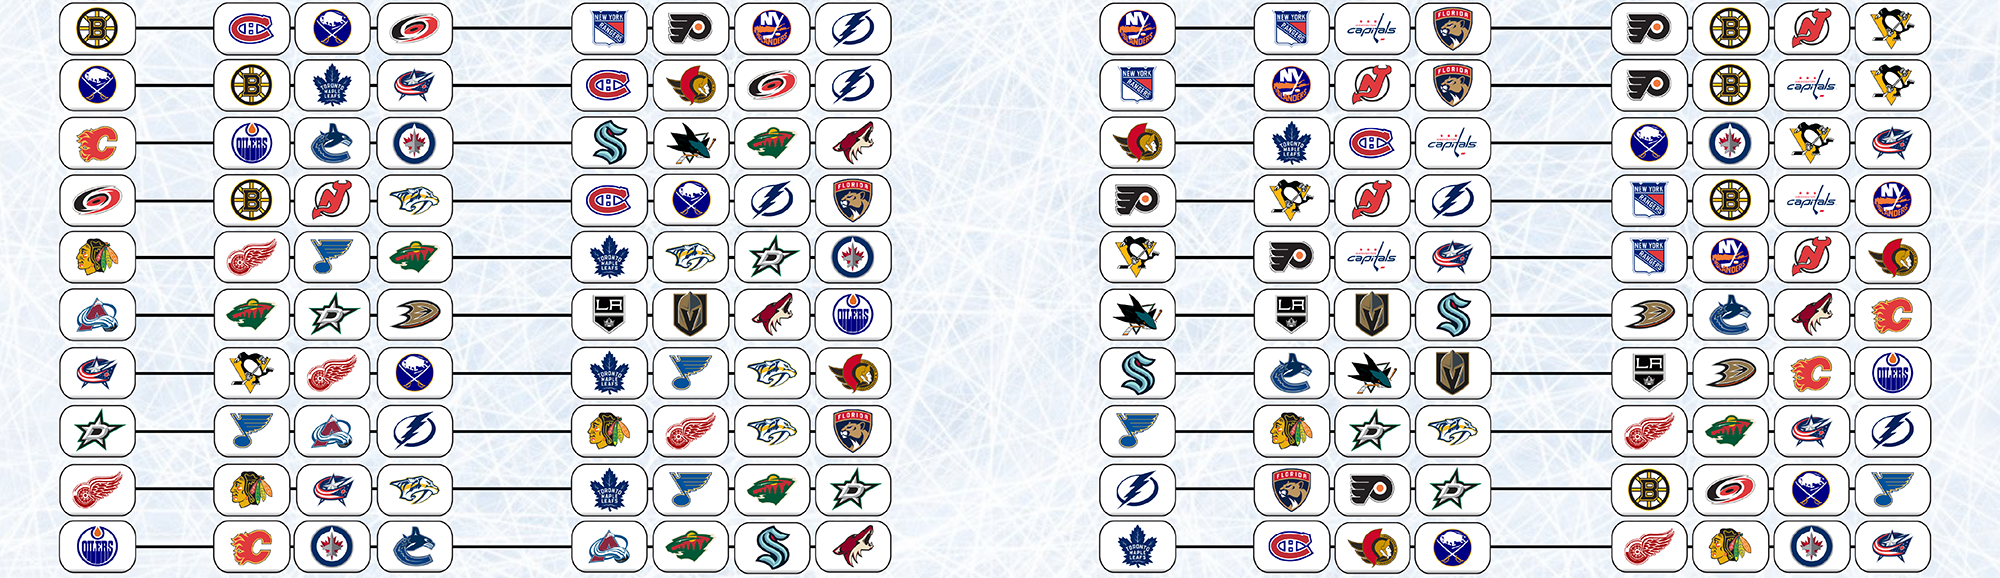
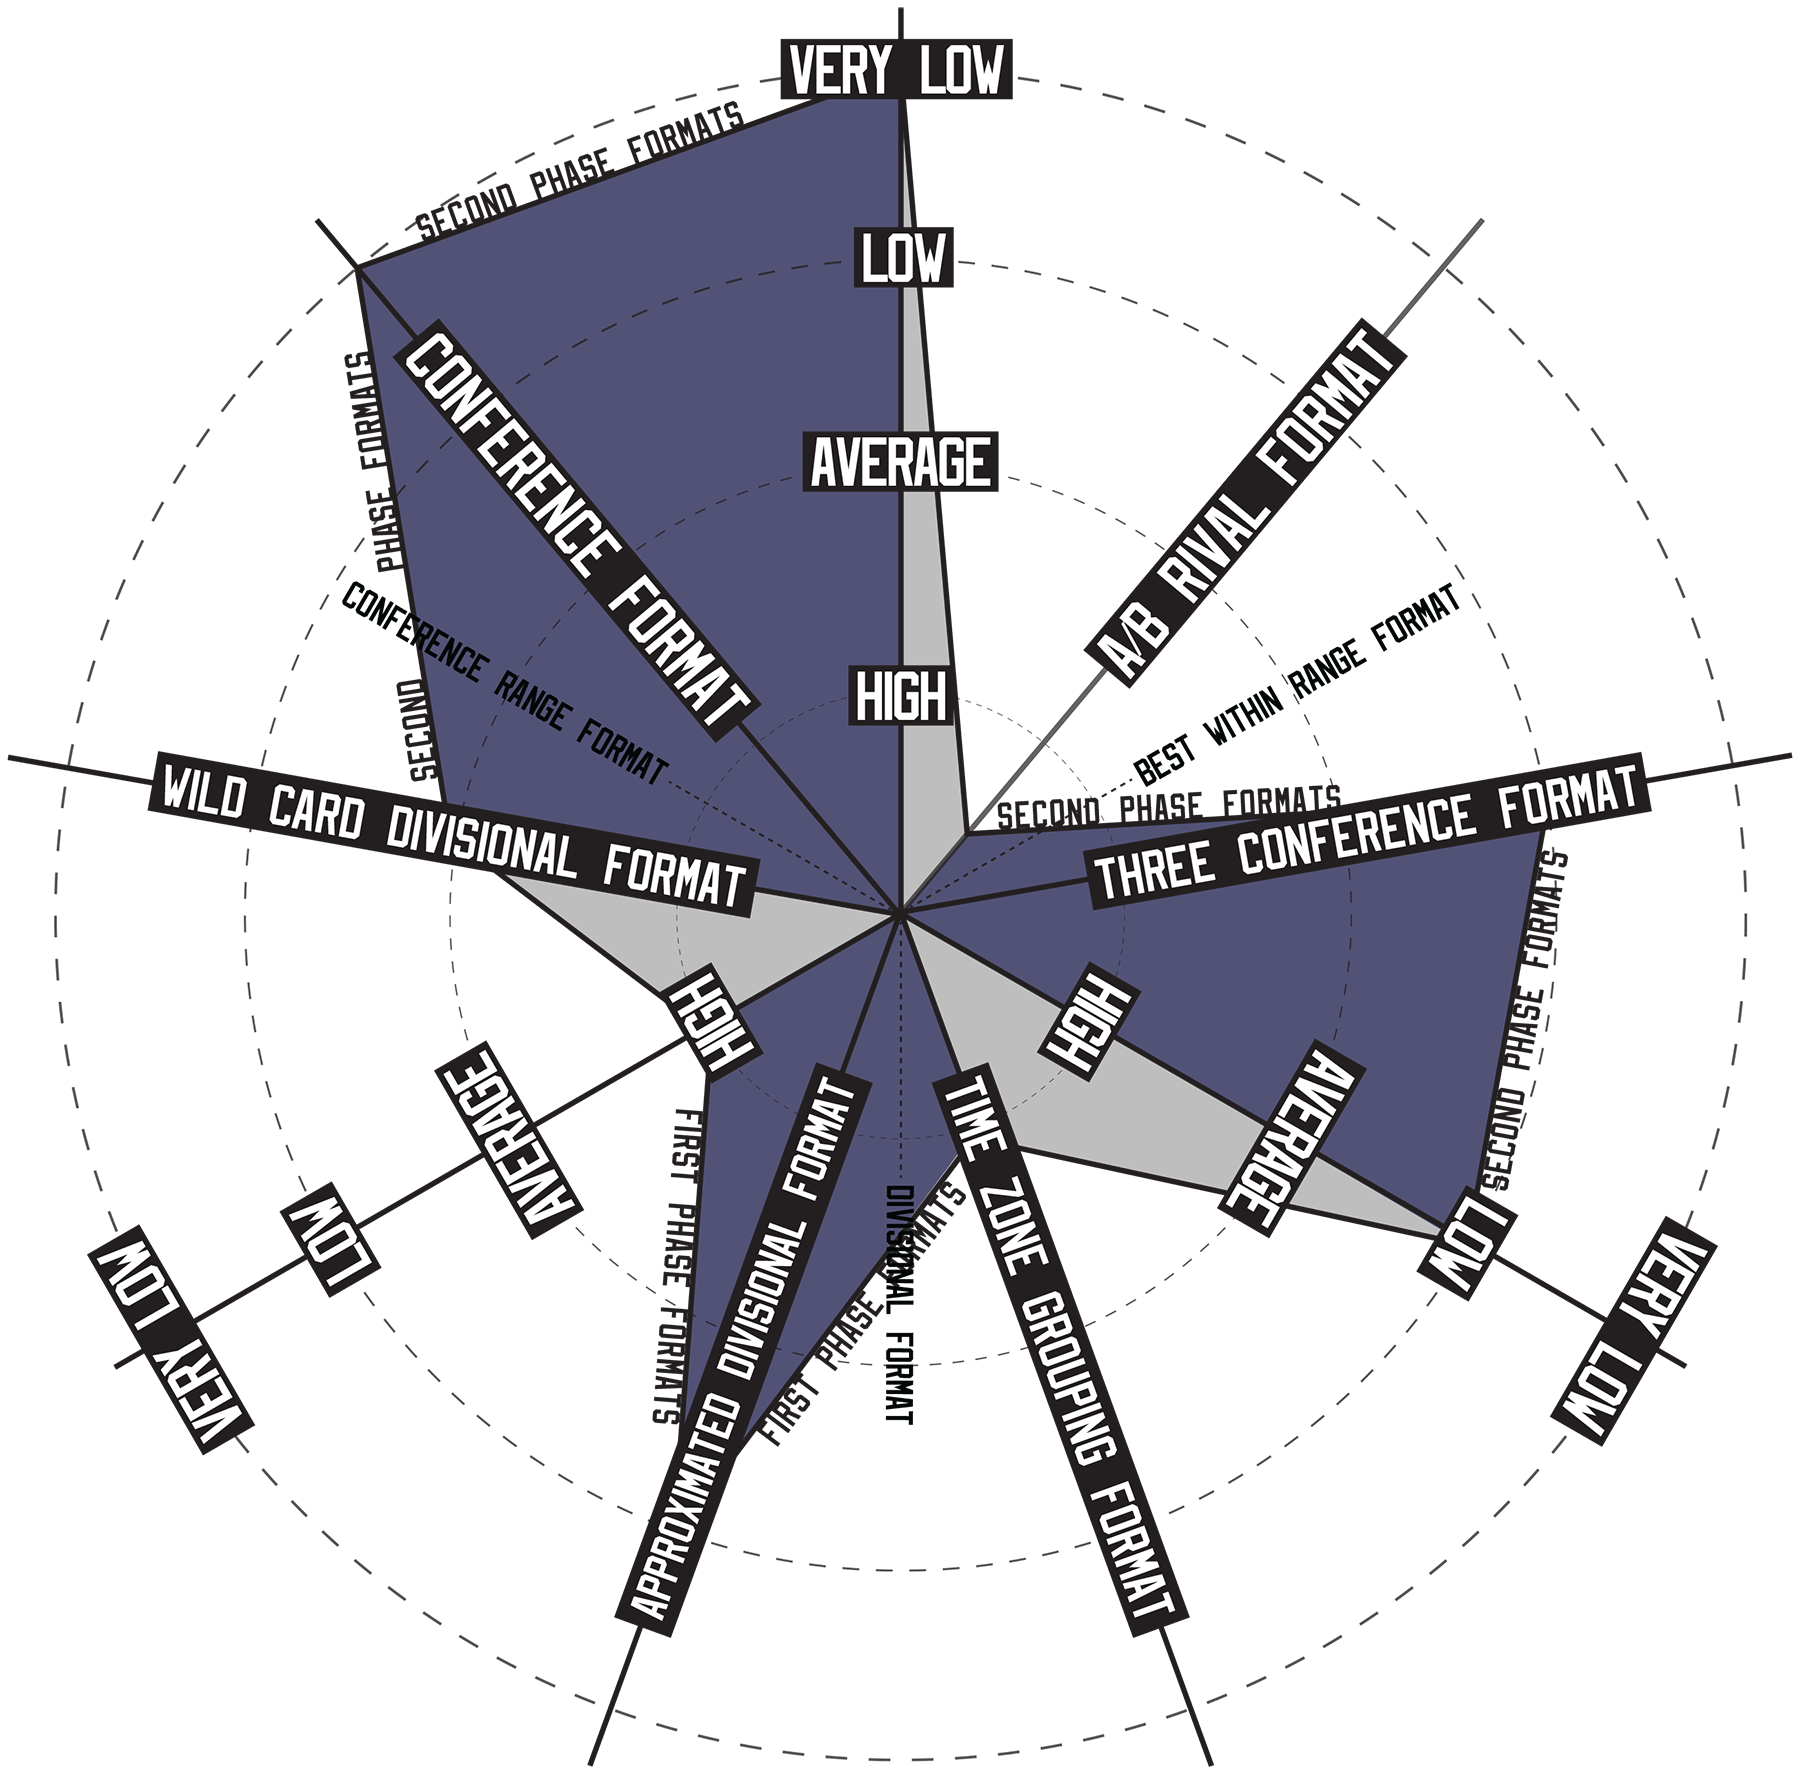
In addition to the fairness value, I also determined a criterion for what constitutes an “unfair matchup”, and recorded the number of these series that occurred in every playoff in my simulations. I define which matchups are “unfair” based on certain seeding combinations, for example, the #1 seed drawing any seed higher than #12 is unfair, while the #16 seed drawing any seed lower than #5 is likewise unfair.
Every team that qualifies for the playoffs, for this metric, is considered to be seed 1-16, in order of record, so teams that are below 16th place do not factor into this assessment as their true position in the standings, but rather where they rank in comparison to only other playoff teams. A fair playoff format must also have a low number of unfair matchups. Here is a graphic showing how this is determined:
The through-line of each colour from left to right shows which seed has which range of opponent seeds that would be considered fair. The chart at the top of this section reflects the average numbers of unfair matchups per 20 season sample size, so a format scoring 110 unfair matchups averages 5.5 unfair matchups per season, out of a maximum possible number of 14 (8 first round series, 4 second round, 2 third round, and the Stanley Cup Final cannot possibly be unfair, as it is the remaining two teams playing in a series).
Findings/Statistical Analysis
Here, I showcase the results of my four 20-season simulations, and discuss what the data reveals about the existing and proposed playoff formats:
Fairness coefficient of variation comparison between all formats
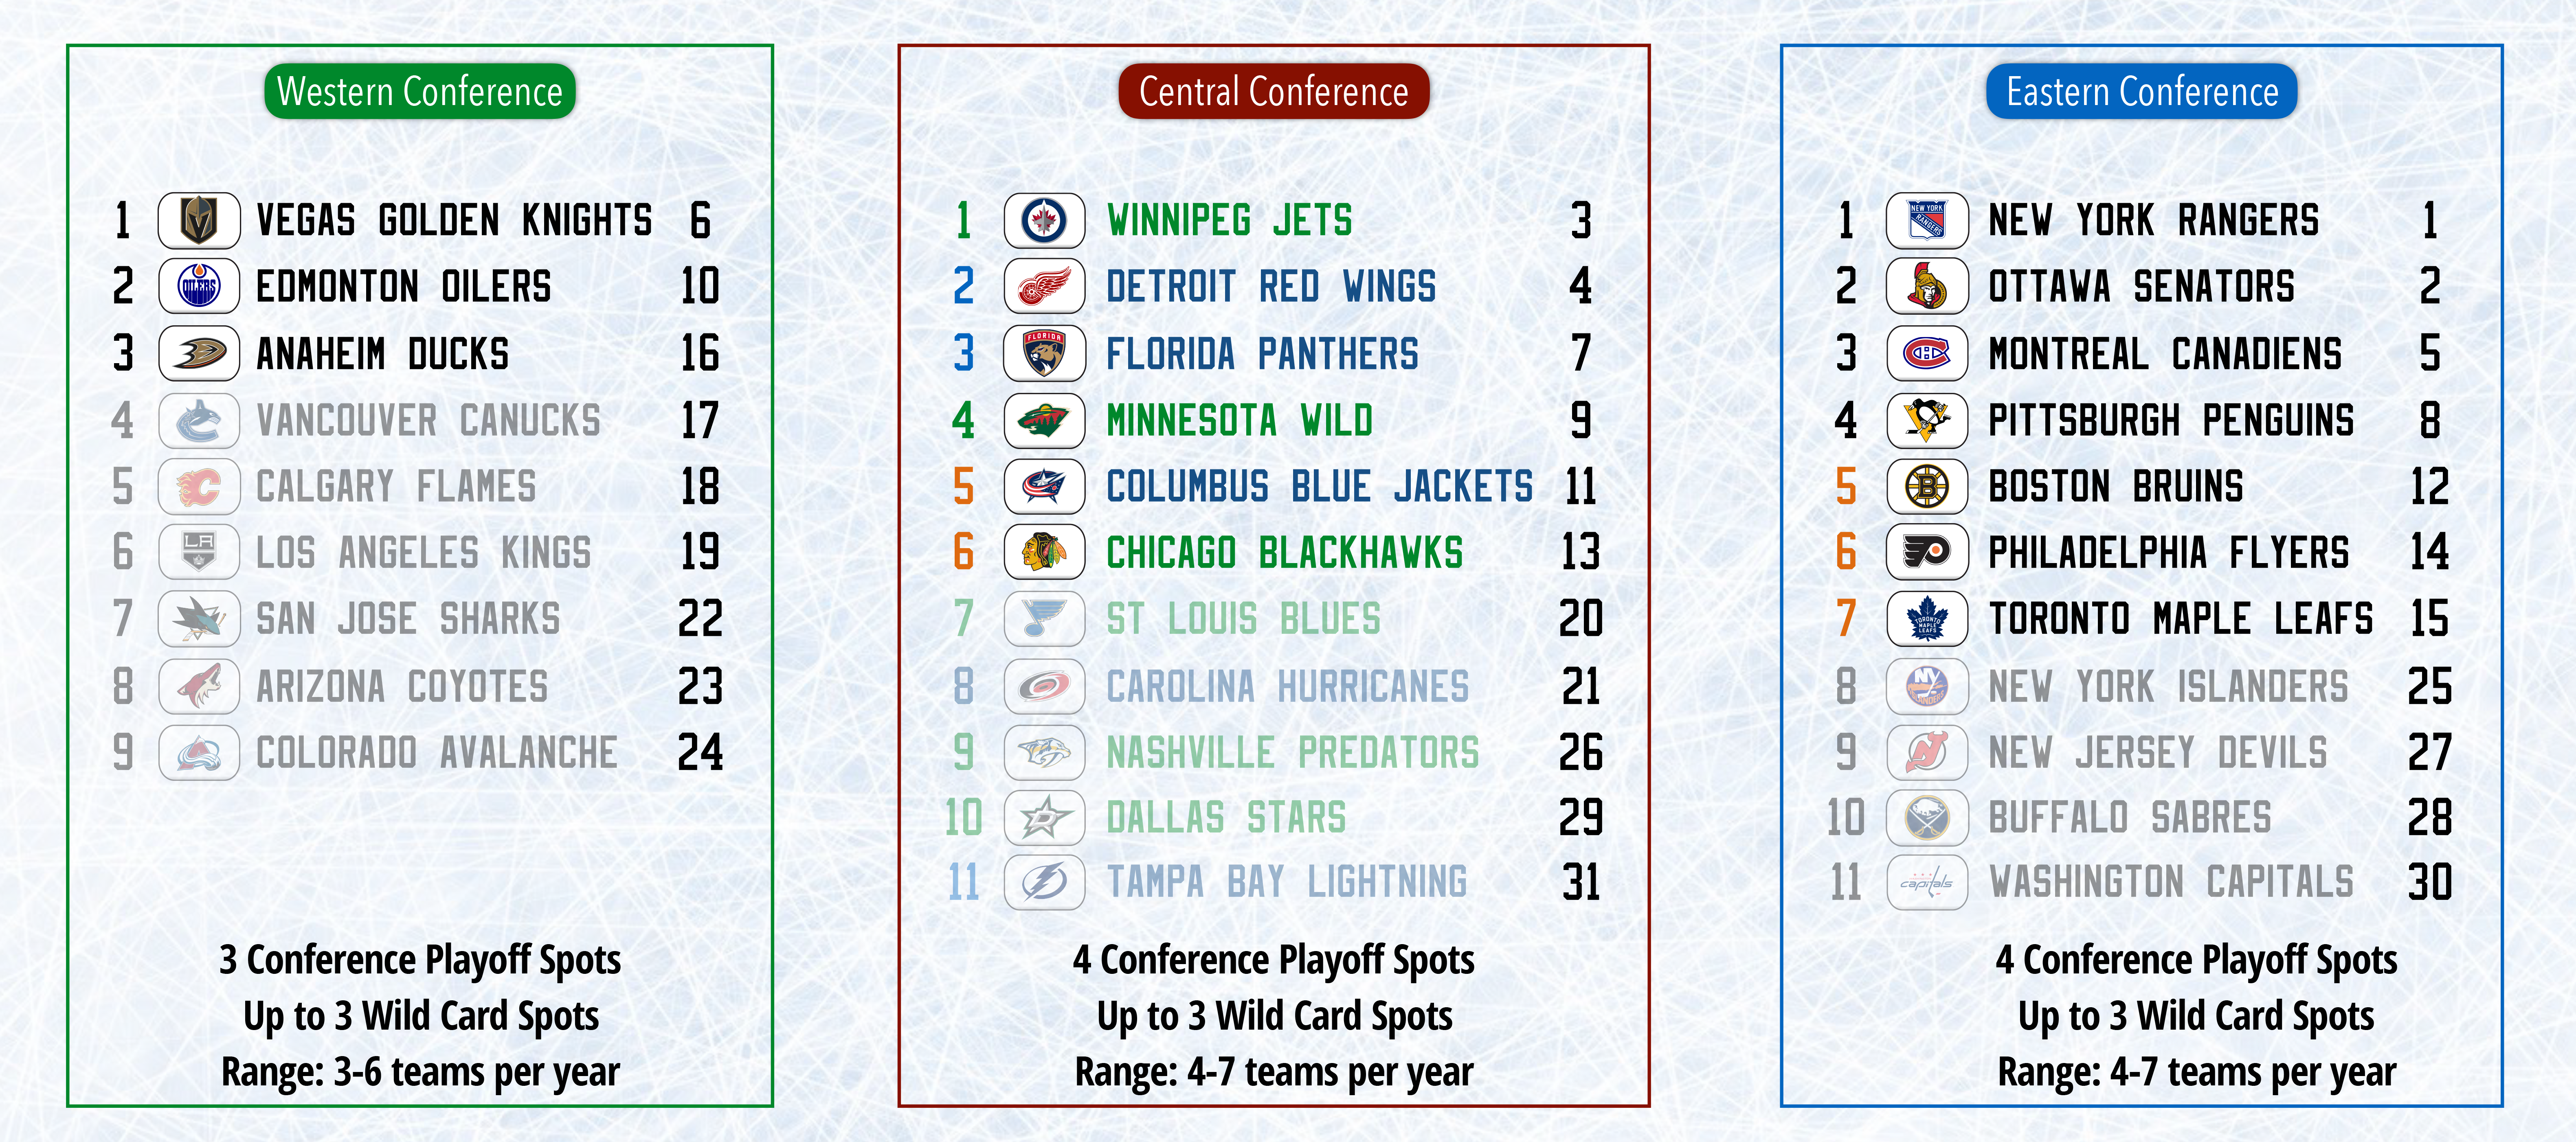
As can be seen in these charts, the formats that have more restrictions on how the teams are grouped generally result in lower fairness value. The main exception is the Time Zone Grouping format, which has restrictions based on time zone, but the crossovers as a result of odd numbers of teams able to make the playoffs create enough flexibility to keep the fairness value strong. The top format in fairness value is Best Within Range, almost certainly due to the fact that it is the only format that is explicitly restricted to the top 16 teams league-wide by record making the playoffs, so it is never subjected to the demerits of a lower team than 16th making and possibly moving on in a playoff year.
The coefficient of variation chart provides some insight into the consistency with which the formats perform well in this category: the most inconsistent format is Divisional, followed by Wild Card Divisional and Conference-Range, while the most consistent performing format is Best-Within-Range, followed by Three Conference, Time Zone Grouping and A/B Rival. All of the formats parallel the fairness value with the coefficient of variance.
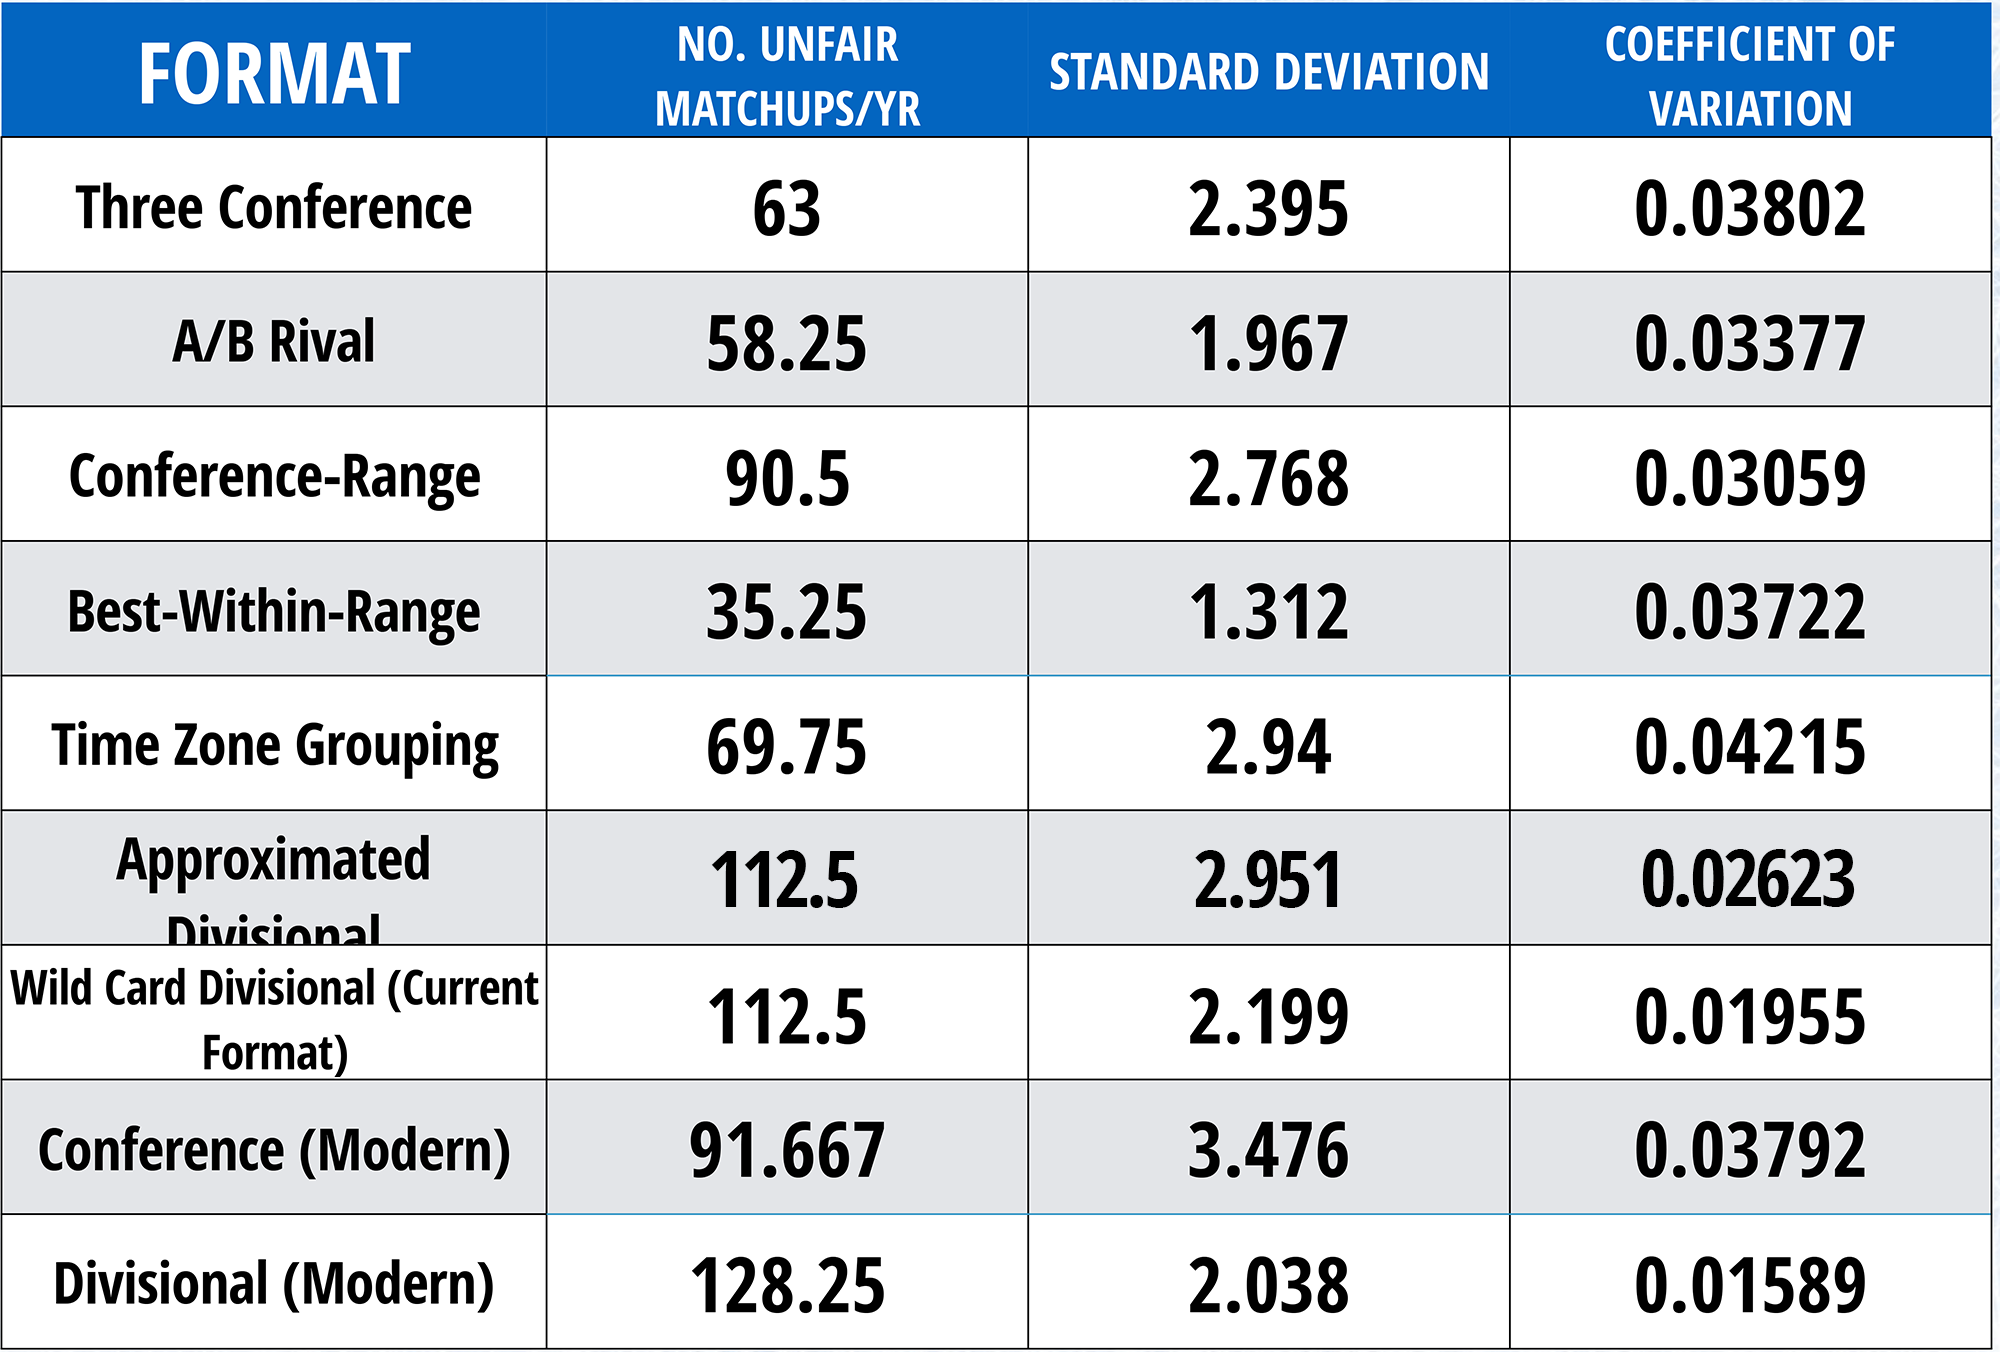
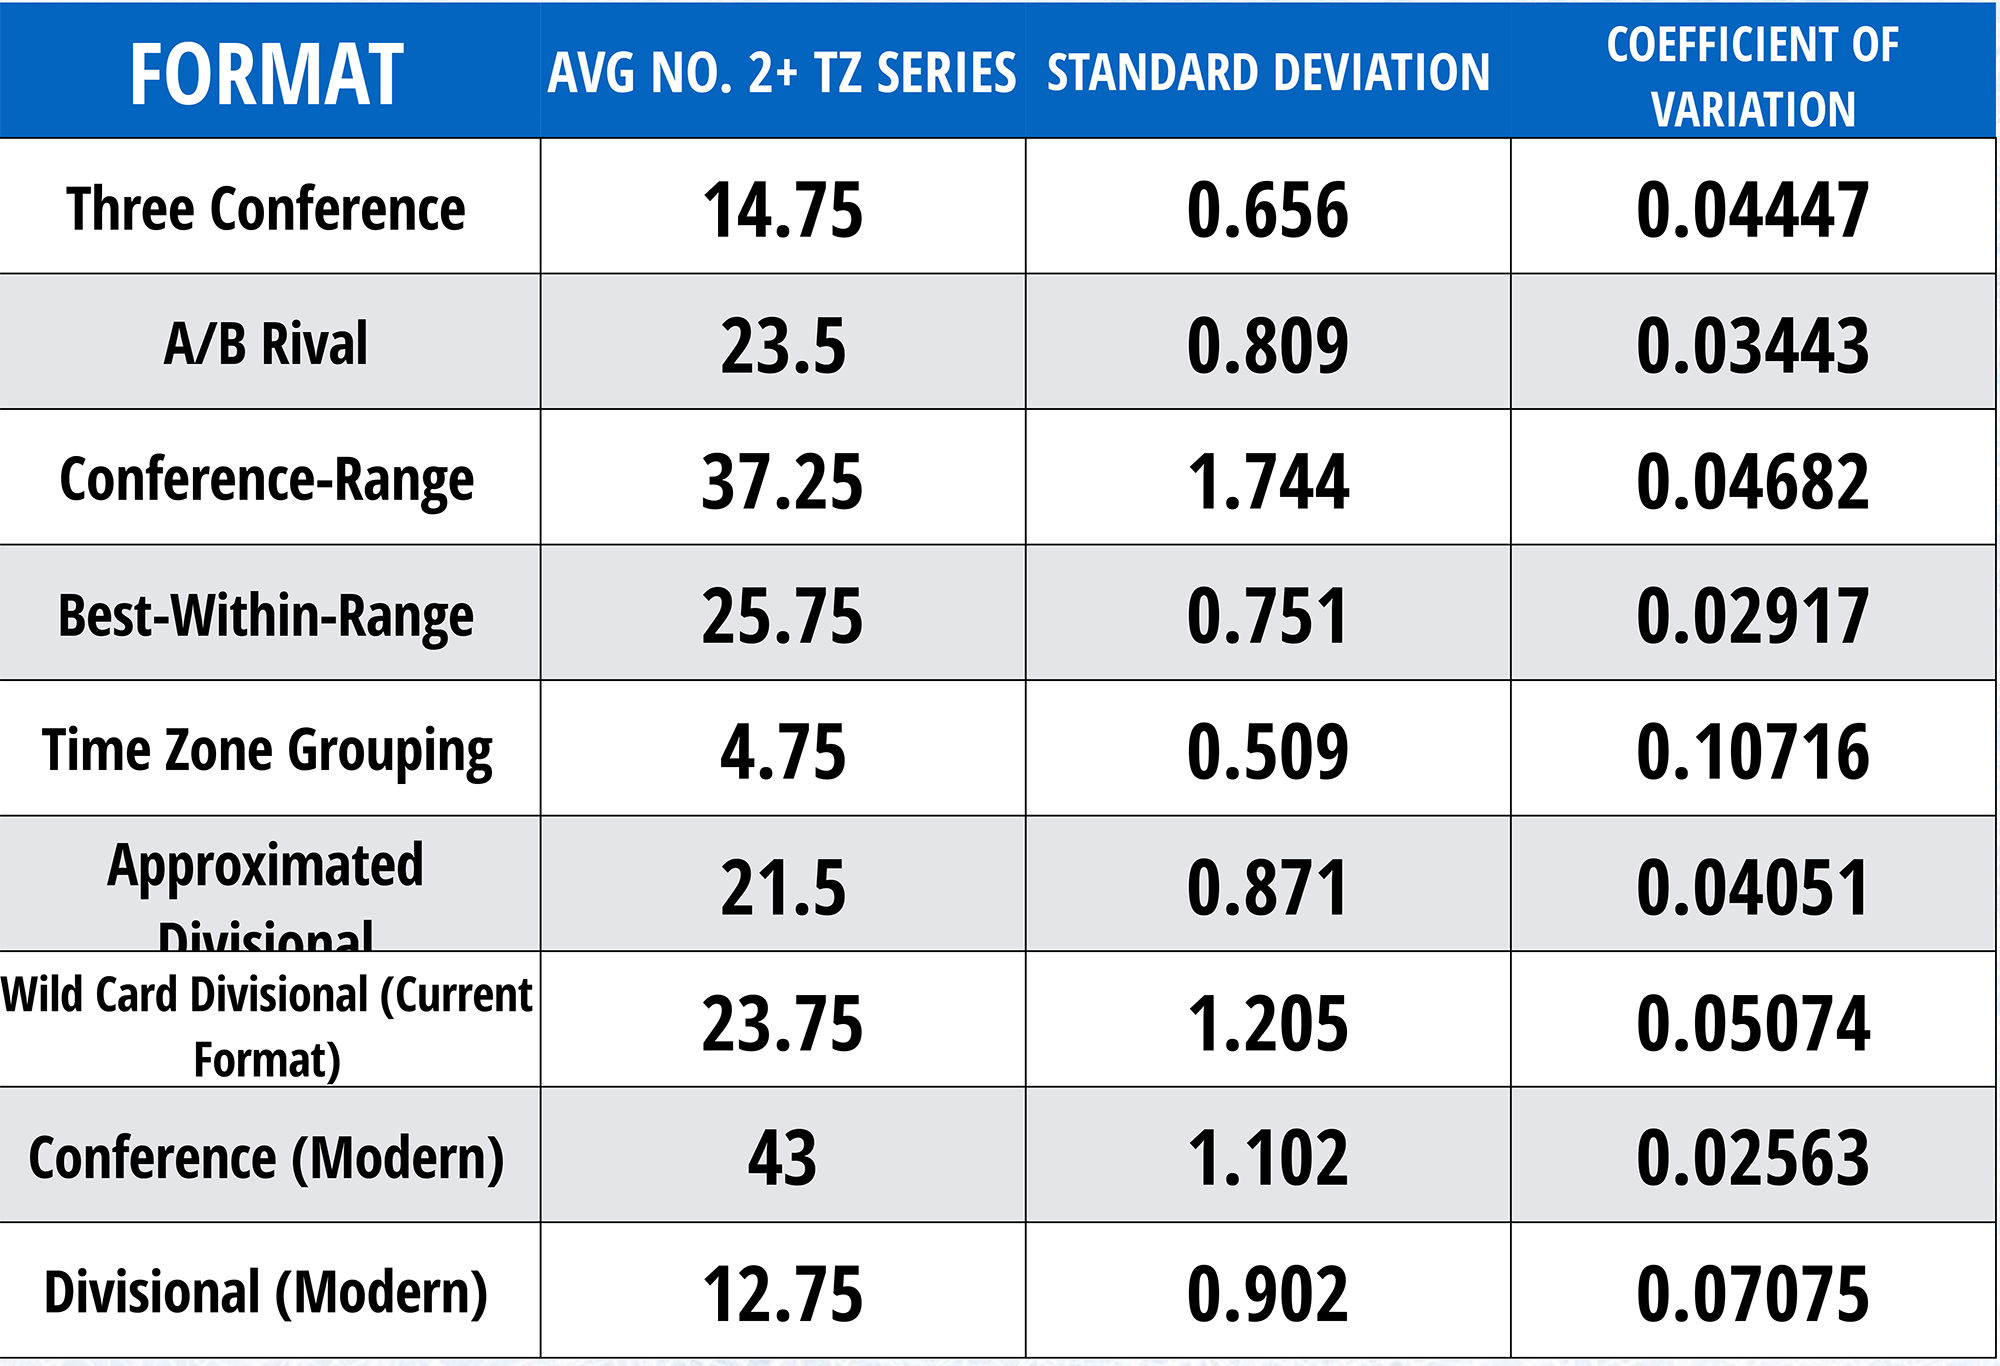
Unfair matchups coefficient of variation comparison between all formats
As a complement to the fairness value, I have also measured unfair matchups across all of my simulations, and the results do show some inconsistencies with fairness value and between these values and the respective coefficients of variation. The most surprising results are the consistency of the Divisional format, scoring very low in the number of unfair matchups, but the highest of all formats in coefficient of variation. Similarly, the Time Zone Grouping format performs very well in the unfair matchup measurement, but very poorly in coefficient of variation, suggesting that it does not consistently produce few unfair matchups year to year. Best-Within-Range fluctuates greatly as well, since it has the best score on unfair matchups (like with fairness value), but scores nearly the worst in coefficient of variation.
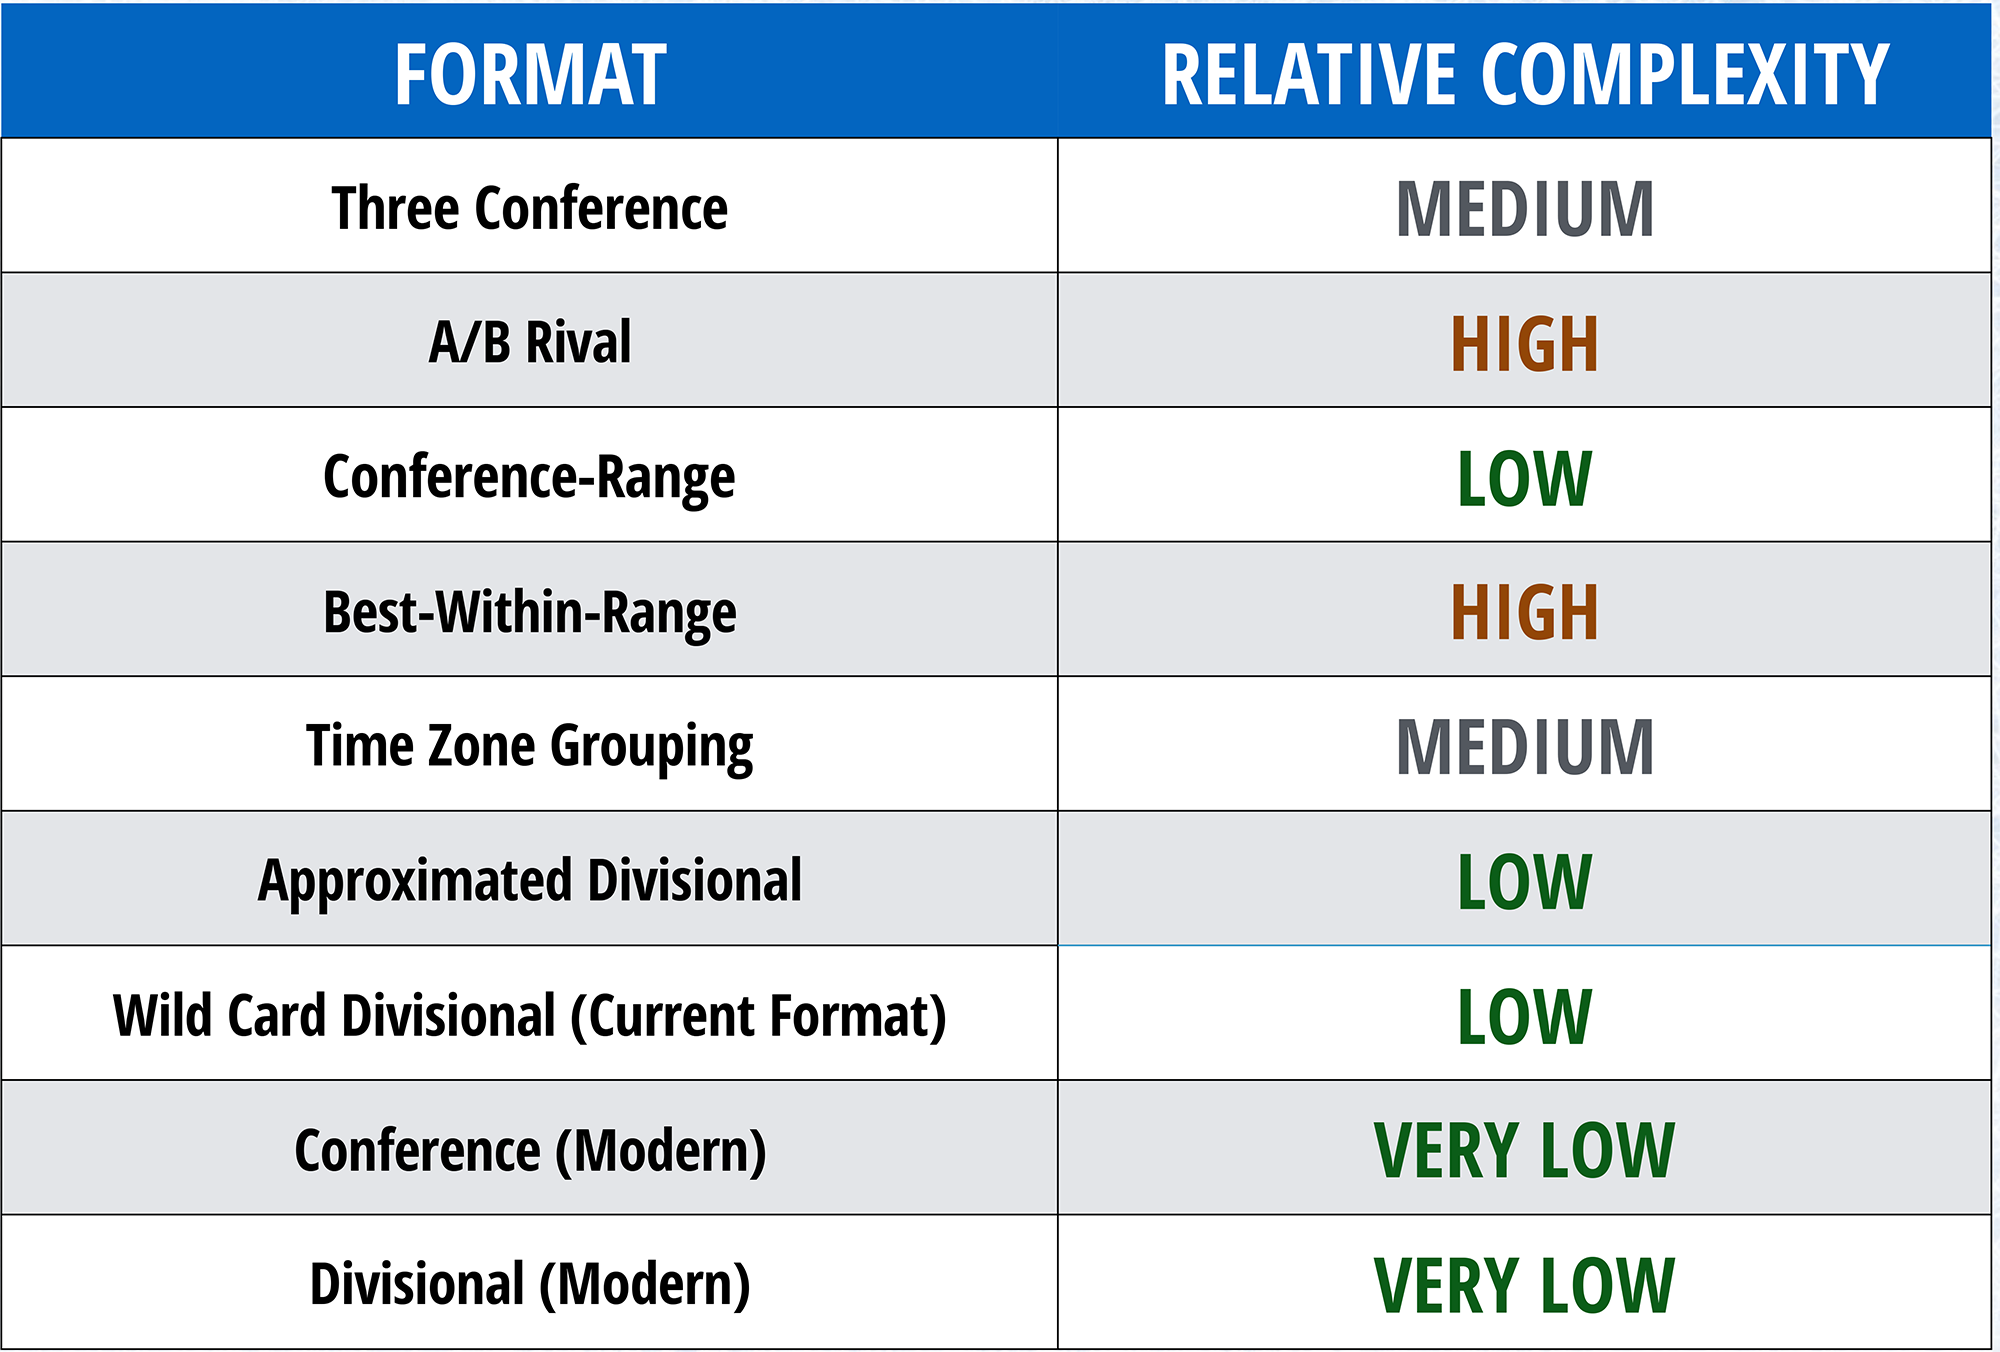
Complexity is the one category that cannot produce statistics on standard deviation and coefficient of variation, since it is not a numerical measurement, but rather a subjective assessment that only exists at five possible results (very low, low, average, high, very high). Thus, there is no variation between sample sizes of each format, they are all the same. So, the only comparisons that can be made are between formats: as should be expected, the Divisional and Conference formats, which use set groups and fixed seeding numbers to determine matchups, are the two simplest formats, while the A/B Rival and Best-Within-Range formats score as the most complex, due to how many different possibilities and factors influencing the determination of the playoff matchups there are. A/B Rival in particular is nothing like any previous format, or any other format that exists in other sports, but its positive aspects are also different, and difficult to measure, for example, the increased competition in the regular season between Rivals, and how many different kinds of playoff races can occur under the format.
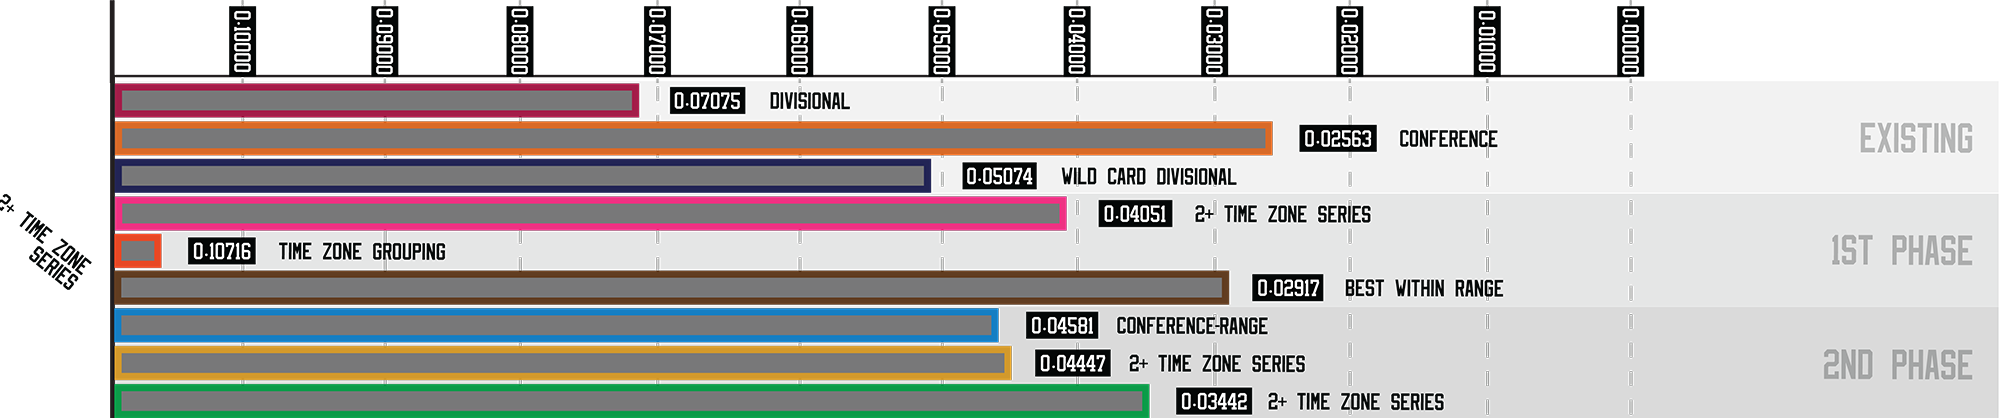
Number of High (2+) Time Zone Series in First 2 Rounds
2+ Time Zone Series coefficient of variation comparison between all formats
Time zone travel is a major focus in my first phase formats, especially the Time Zone Grouping format. All three existing formats struggle in this aspect, even the Divisional format, by virtue of there being no possible way to align the 4 divisions without having at least one of them span 3 time zones. The average of 12.75 series per 20 seasons is entirely as a result of having one team (Arizona) from the Pacific time zone in the Central Division. Meanwhile, the Conference format has the most time zone travel of any format, but its numbers are the most consistent, and the Time Zone Grouping format has the lowest total, but by far the least consistency (quite possibly a correlation, since low numbers are more prone to variations in this statistic).
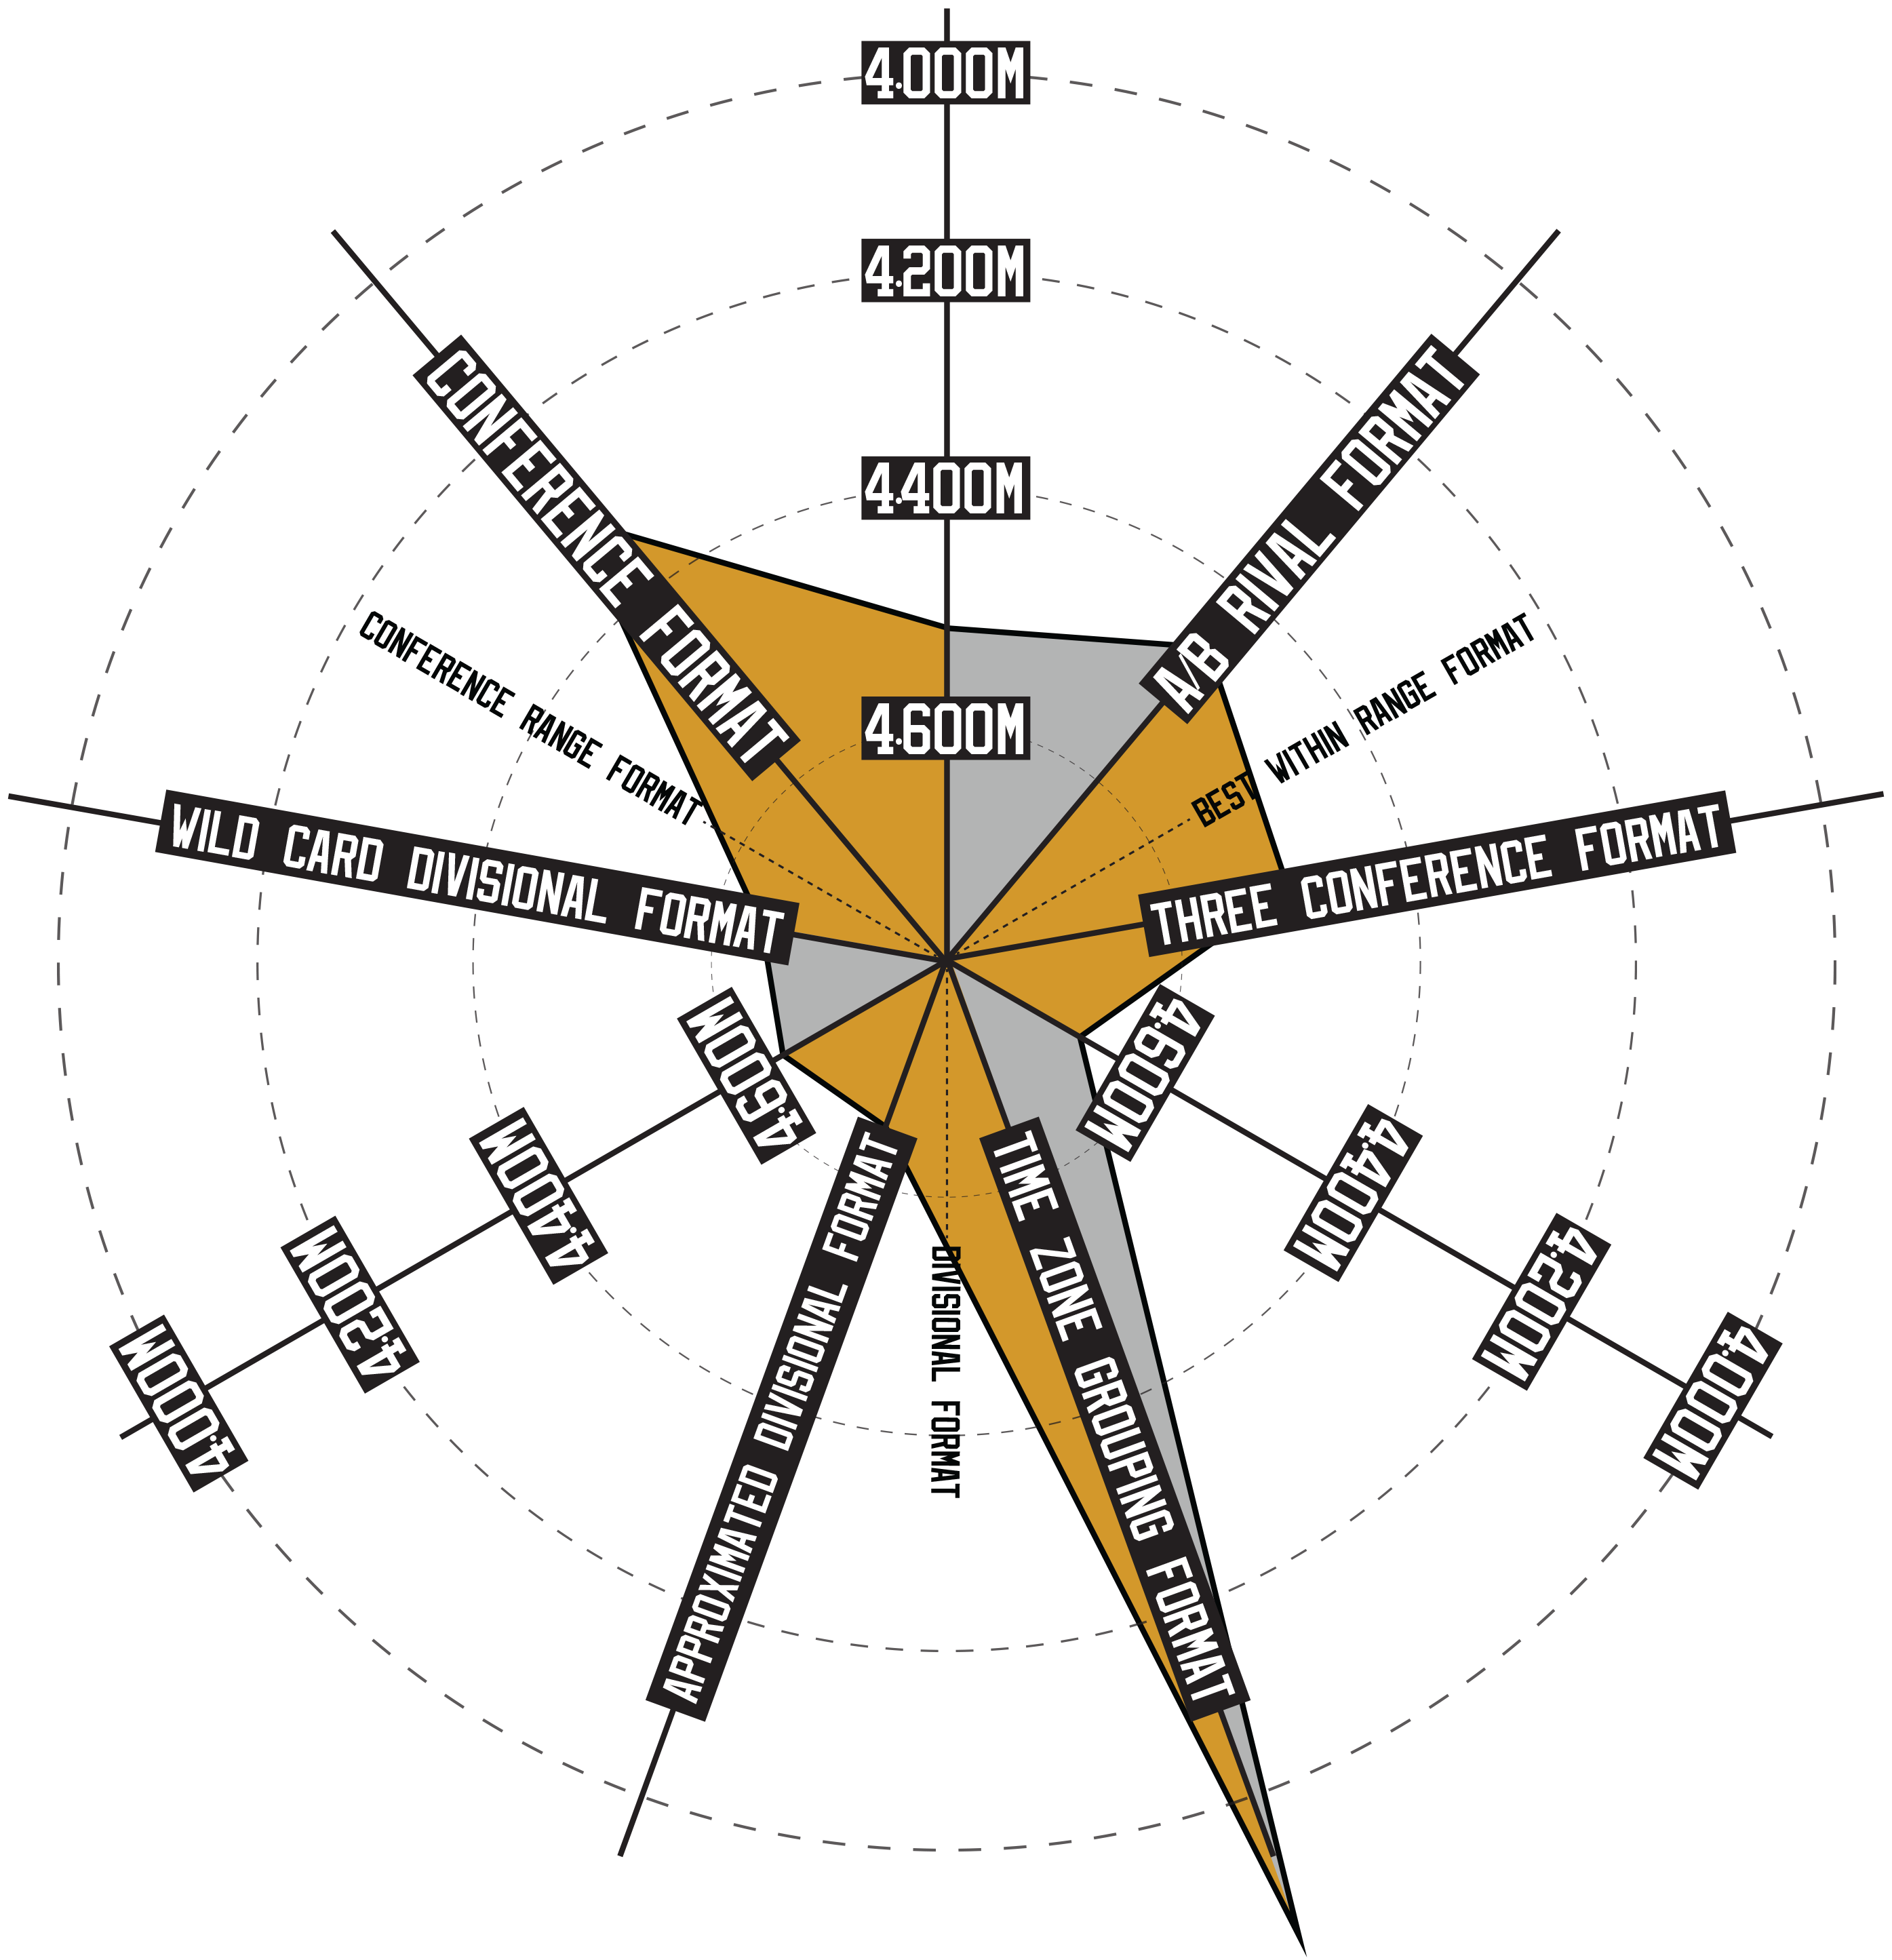
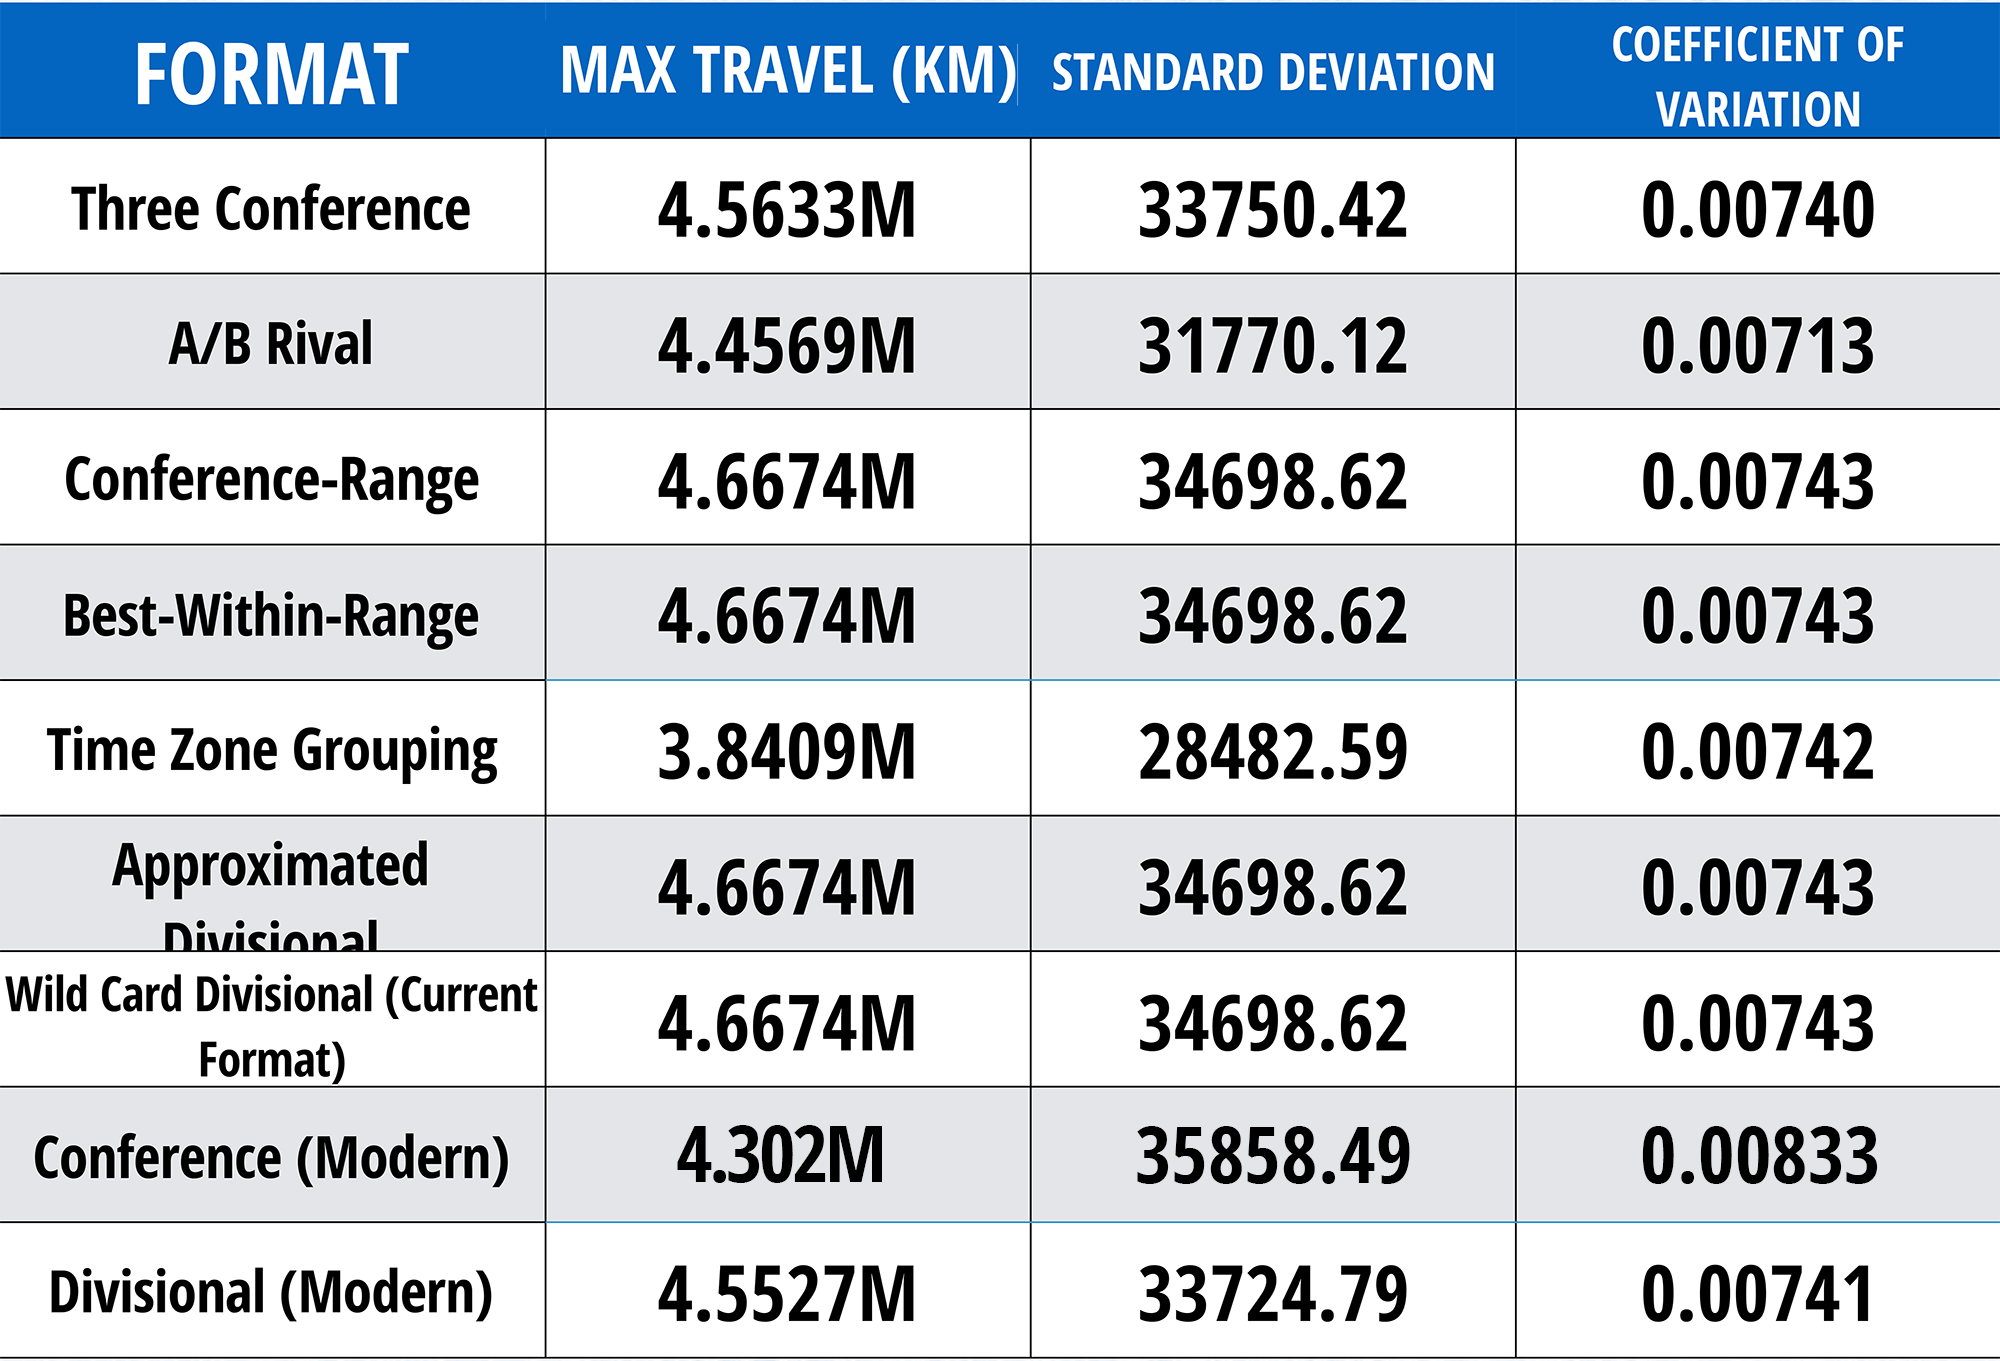
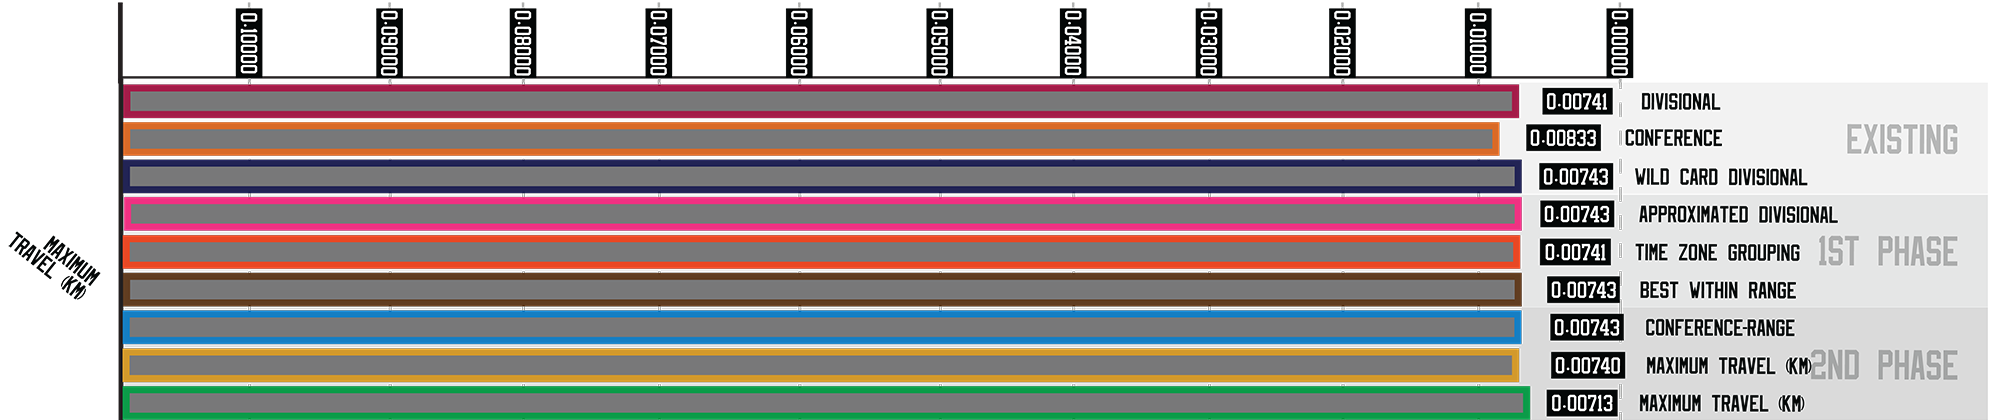
Maximum Total Travel (KM)
Maximum Travel coefficient of variation comparison between all formats
Maximum total travel was a challenge to represent effectively in a data set, since one format vastly outperforms all of the others. Both of the top two formats in this category do not require 2 games per year against all non-Divisional and non-Conference opponents, which is the largest possible reduction on travel. There is virtually no variation whatsoever, despite the drastic differences in travel amounts, so each of the formats has a proportional variation in travel per team based on the total amount. Four of these formats (Wild Card Divisional, Approximated Divisional, Best Within Range and Conference-Range) have identical travel totals, because they each use the same schedule, that being the current schedule under the Wild Card Divisional format, which sees teams play their Division rivals 4 times per year, Conference rivals 3 times (if possible), and non-Conference teams twice.
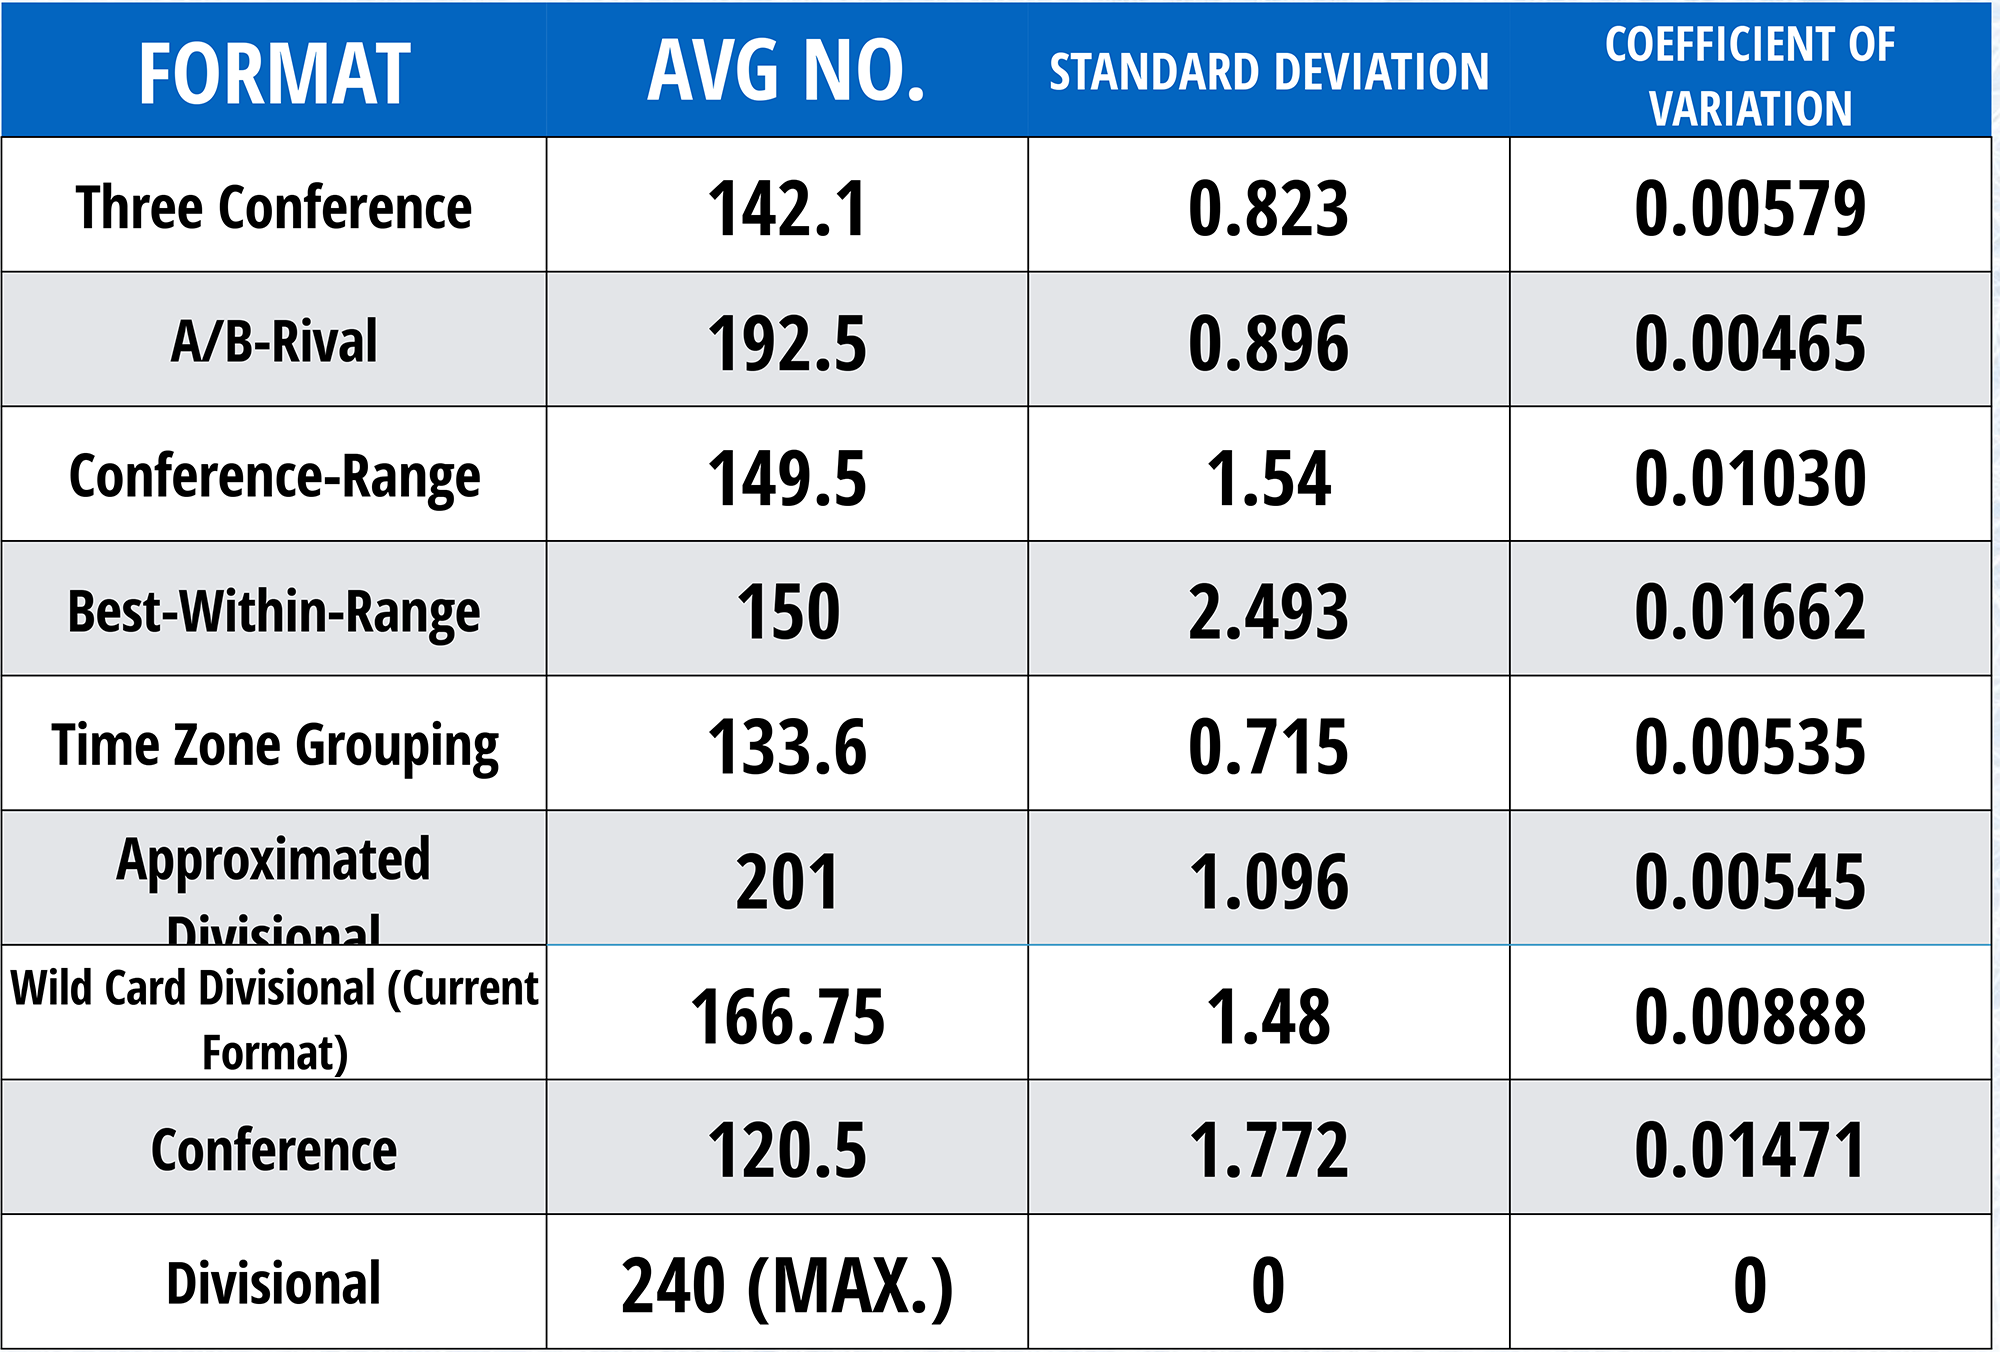
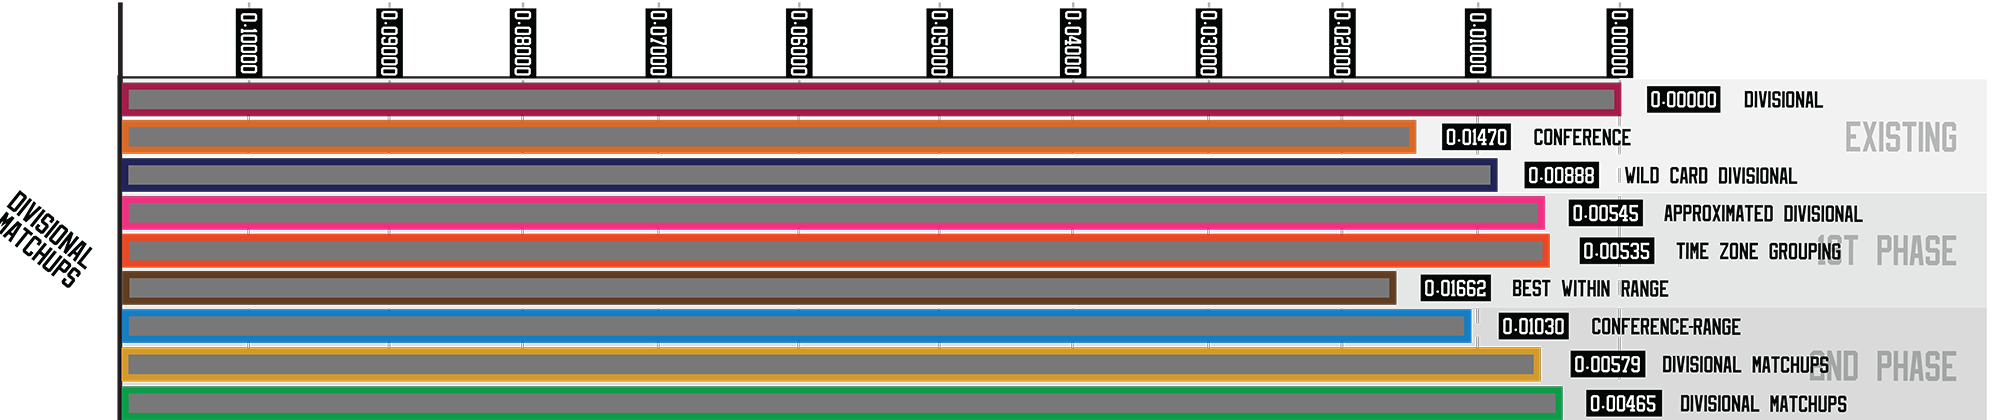
Number of Divisional Series in First 2 Rounds
Maximum Travel coefficient of variation comparison between all formats
This is a very consistent statistic overall, particularly among my proposed formats, with the outlier being the Divisional format, which has the maximum number of such matchups and zero variation. This is one area that demonstrates an advantage of the Approximated Divisional format over Wild Card Divisional, which are two highly comparable formats. Just from restricting the matchups to Divisional when there is an even split of teams from each Division that make the playoffs in each Conference, instead of allowing the possibility of two Wild Card teams switching to the opposite Division’s bracket for the sake of fairness, the Approximated Divisional format comes out significantly ahead in total Divisional series, and is slightly more consistent as well. As expected, Best Within Range has the worst consistency in this area, because it has restrictions that cause wild variations in how many Divisional matchups are able to occur season to season, but its relative flexibility allows it to score an average total for Divisional matchups.
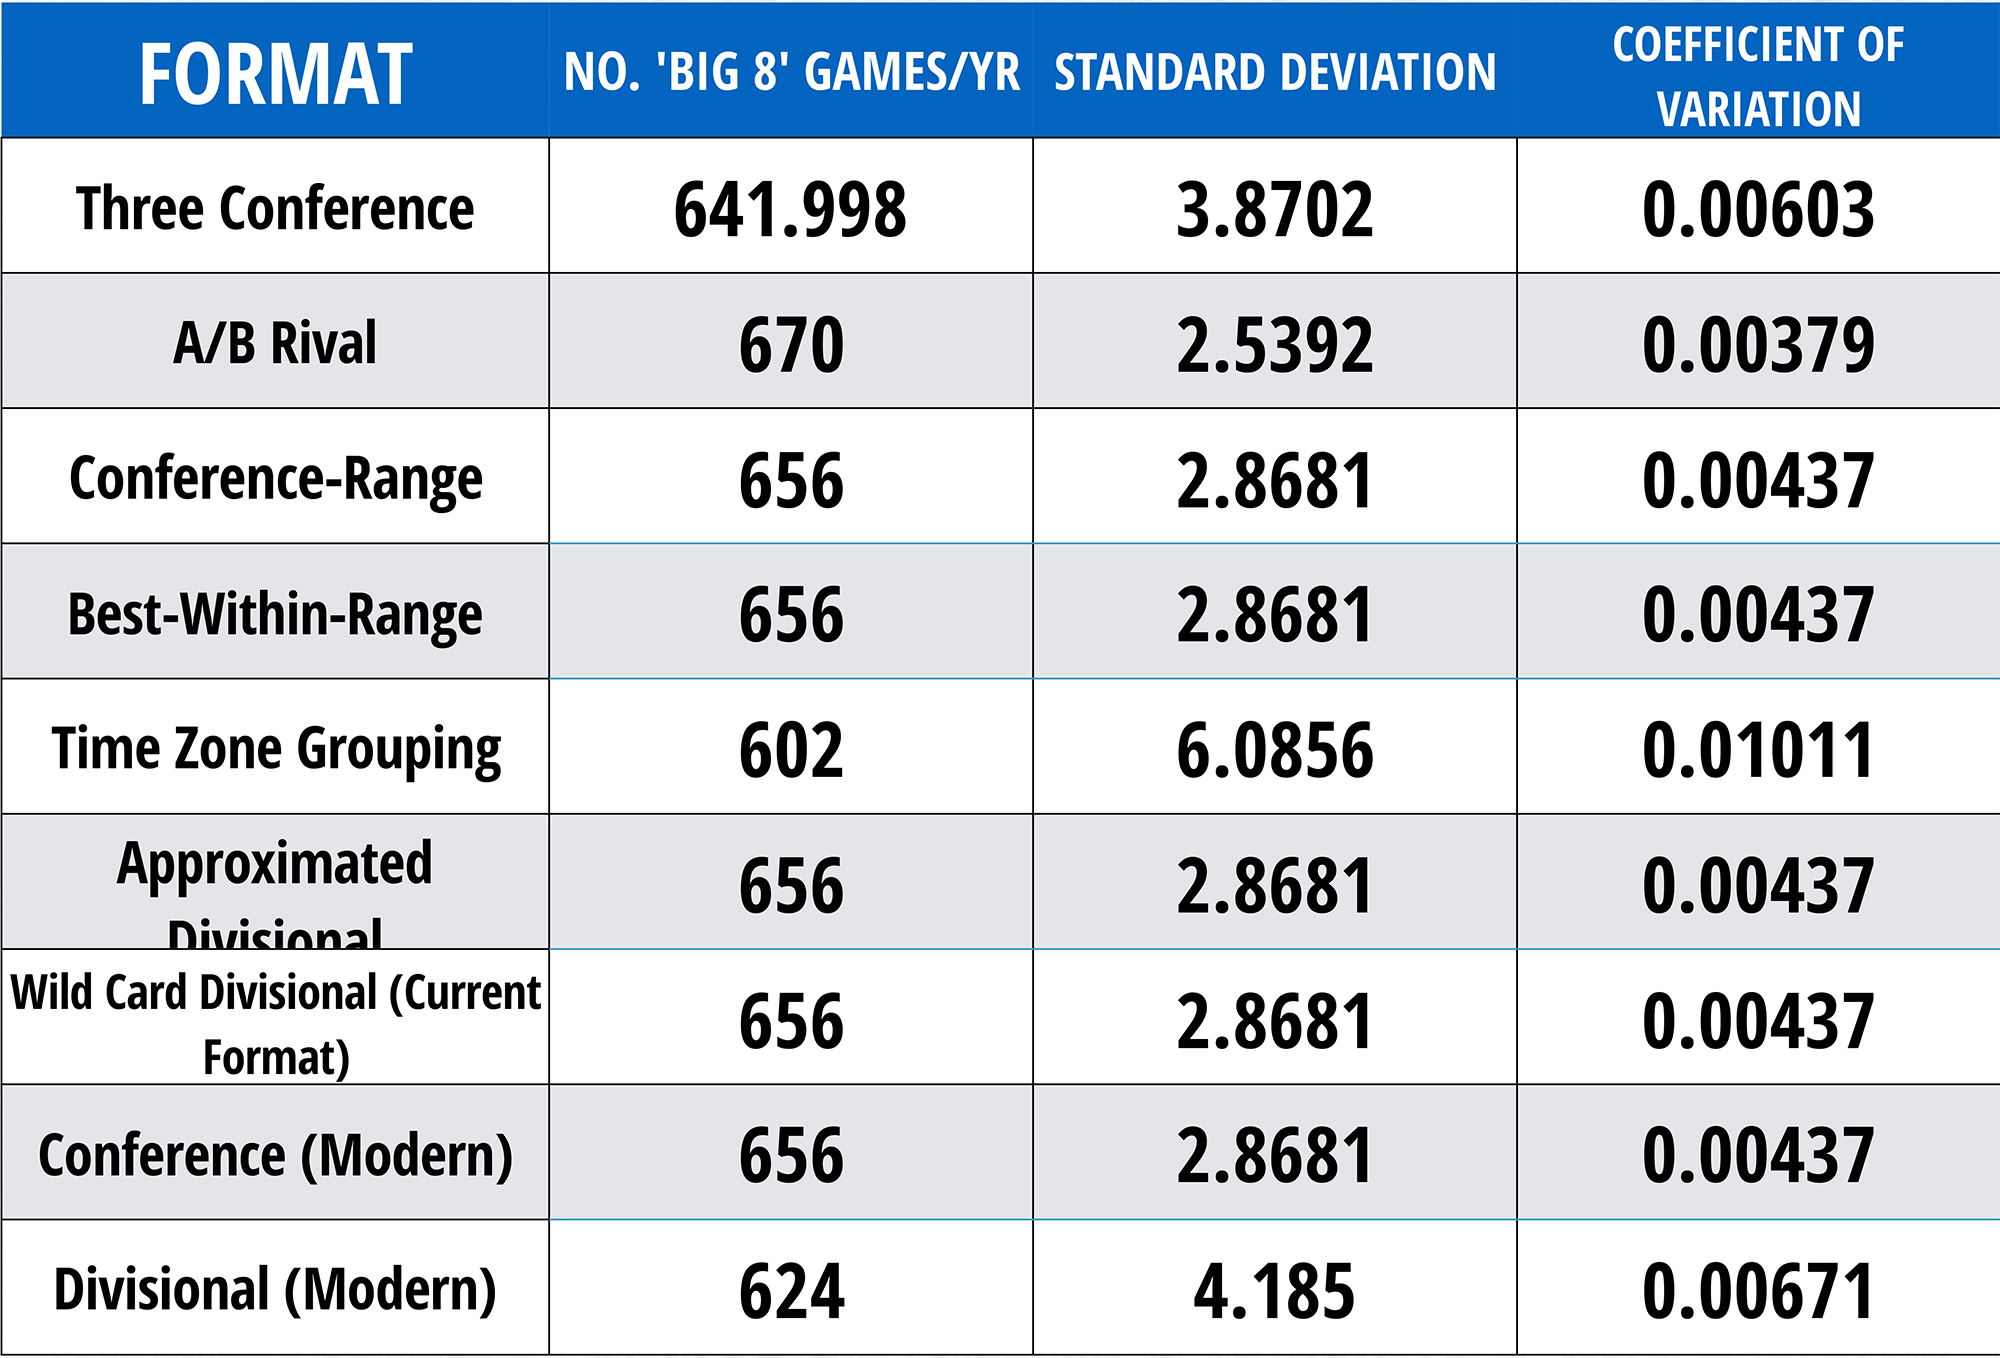
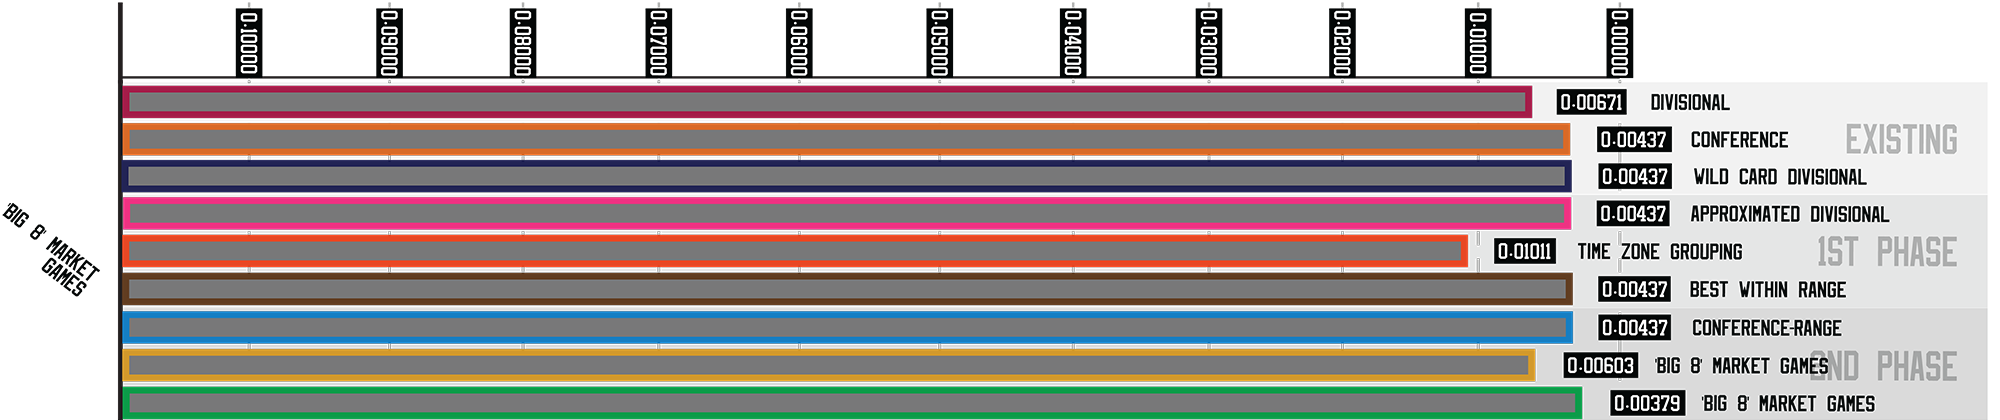
Number of ‘Big 8’ Games per Season
Maximum Travel coefficient of variation comparison between all formats
Finally, the number of “Big 8” games per season is quite balanced in overall numbers between the existing, first phase and second phase formats. The worst performing format is Time Zone Grouping, since it locks up 6 of the 8 markets into one group, and has one more (Chicago) play 2 games per year versus all of the others, while Los Angeles only plays Chicago twice, and the other 6 once per year. Most other formats have at least 2 games per year against every team, so that is the source of this large deficit in games. In terms of base numbers and coefficient of variation, the A/B Rival format performs the best, as this is one of its specialties: because it does not have set groups of teams with solid borders between them, the Big 8 markets are distributed as much as reasonably possible, resulting in the most Big 8 games, and the best consistency.
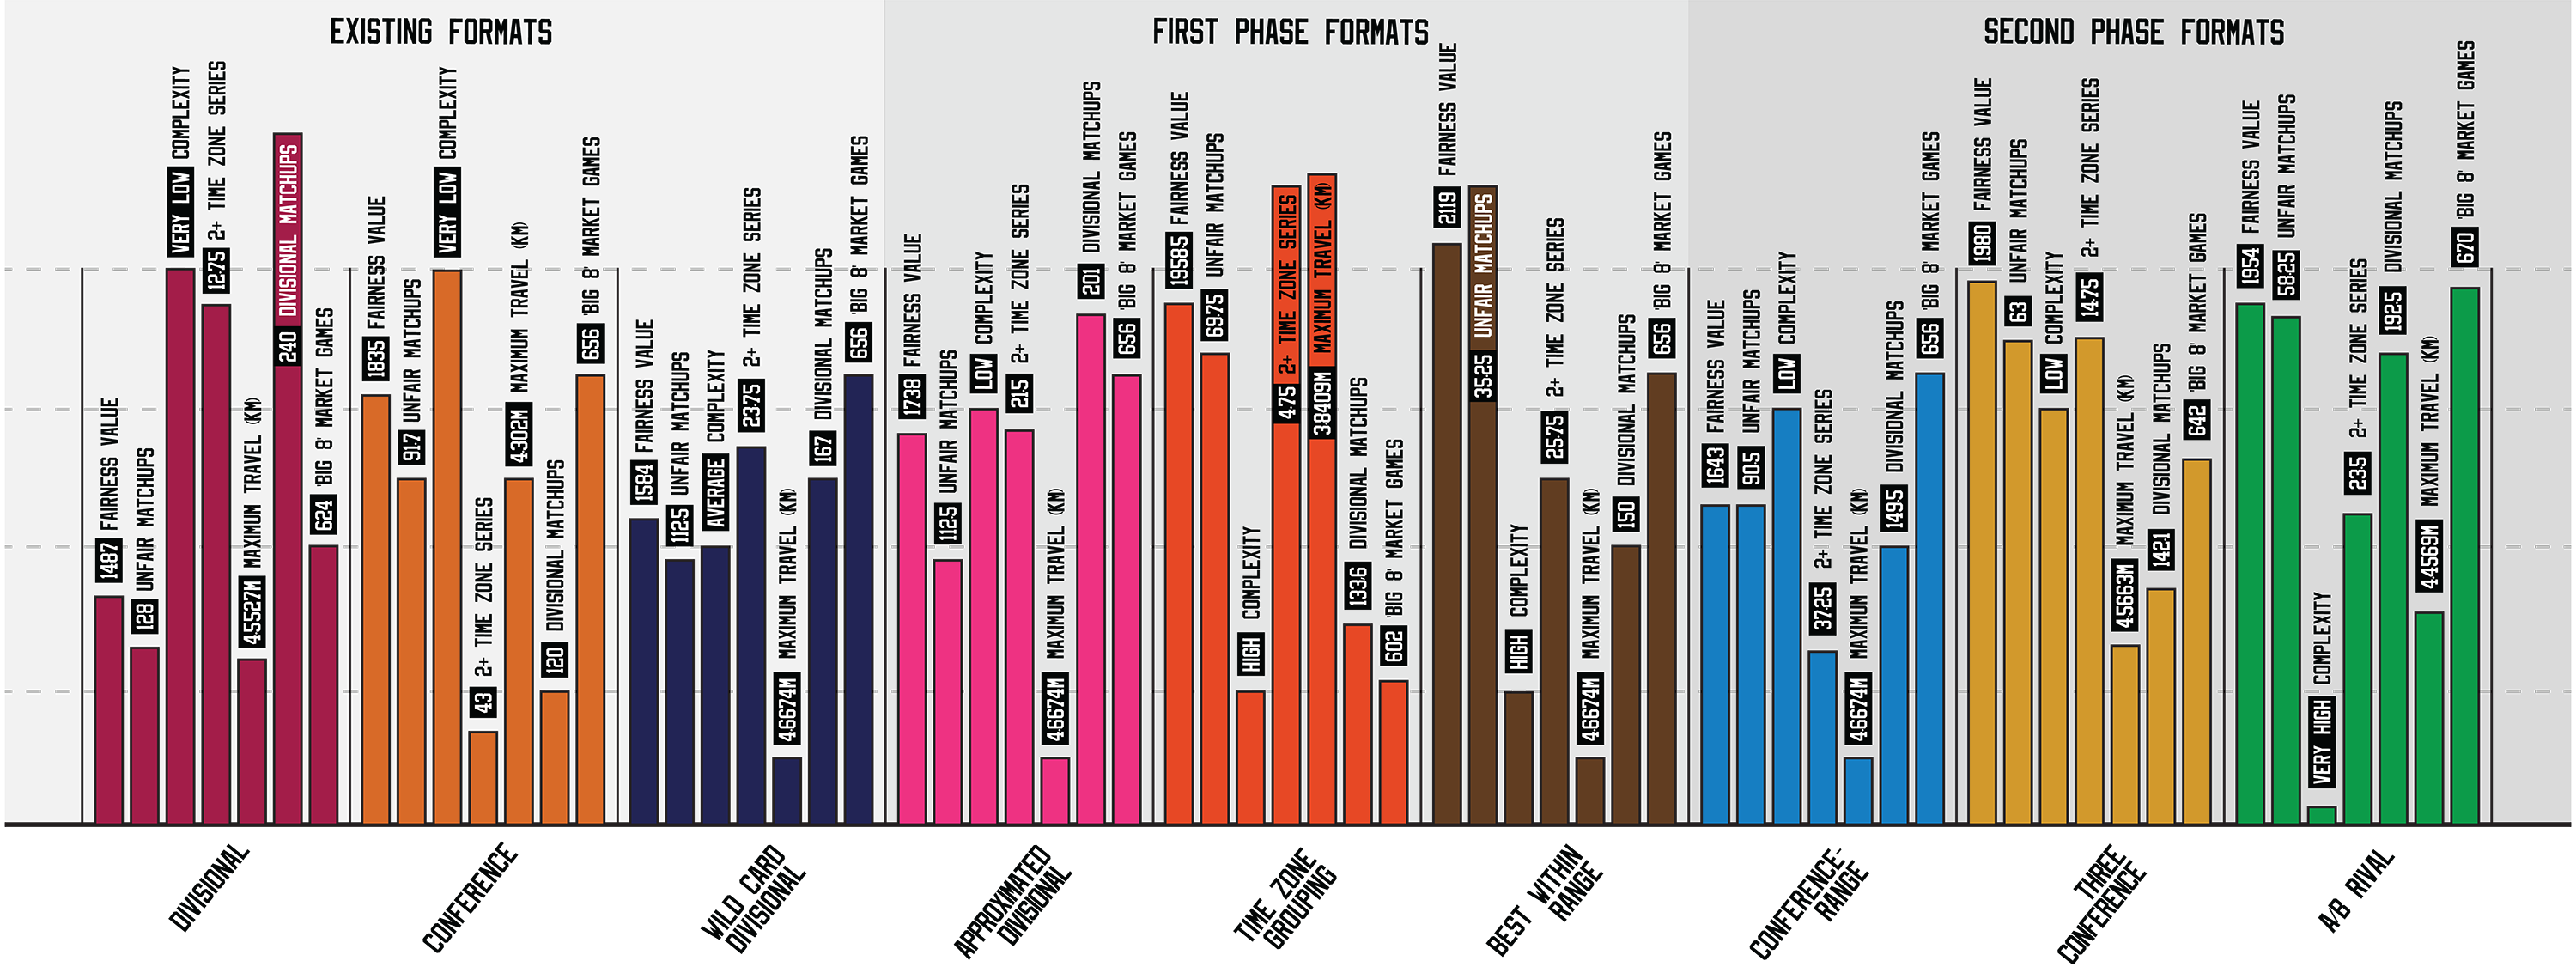
Full Statistical Comparisons
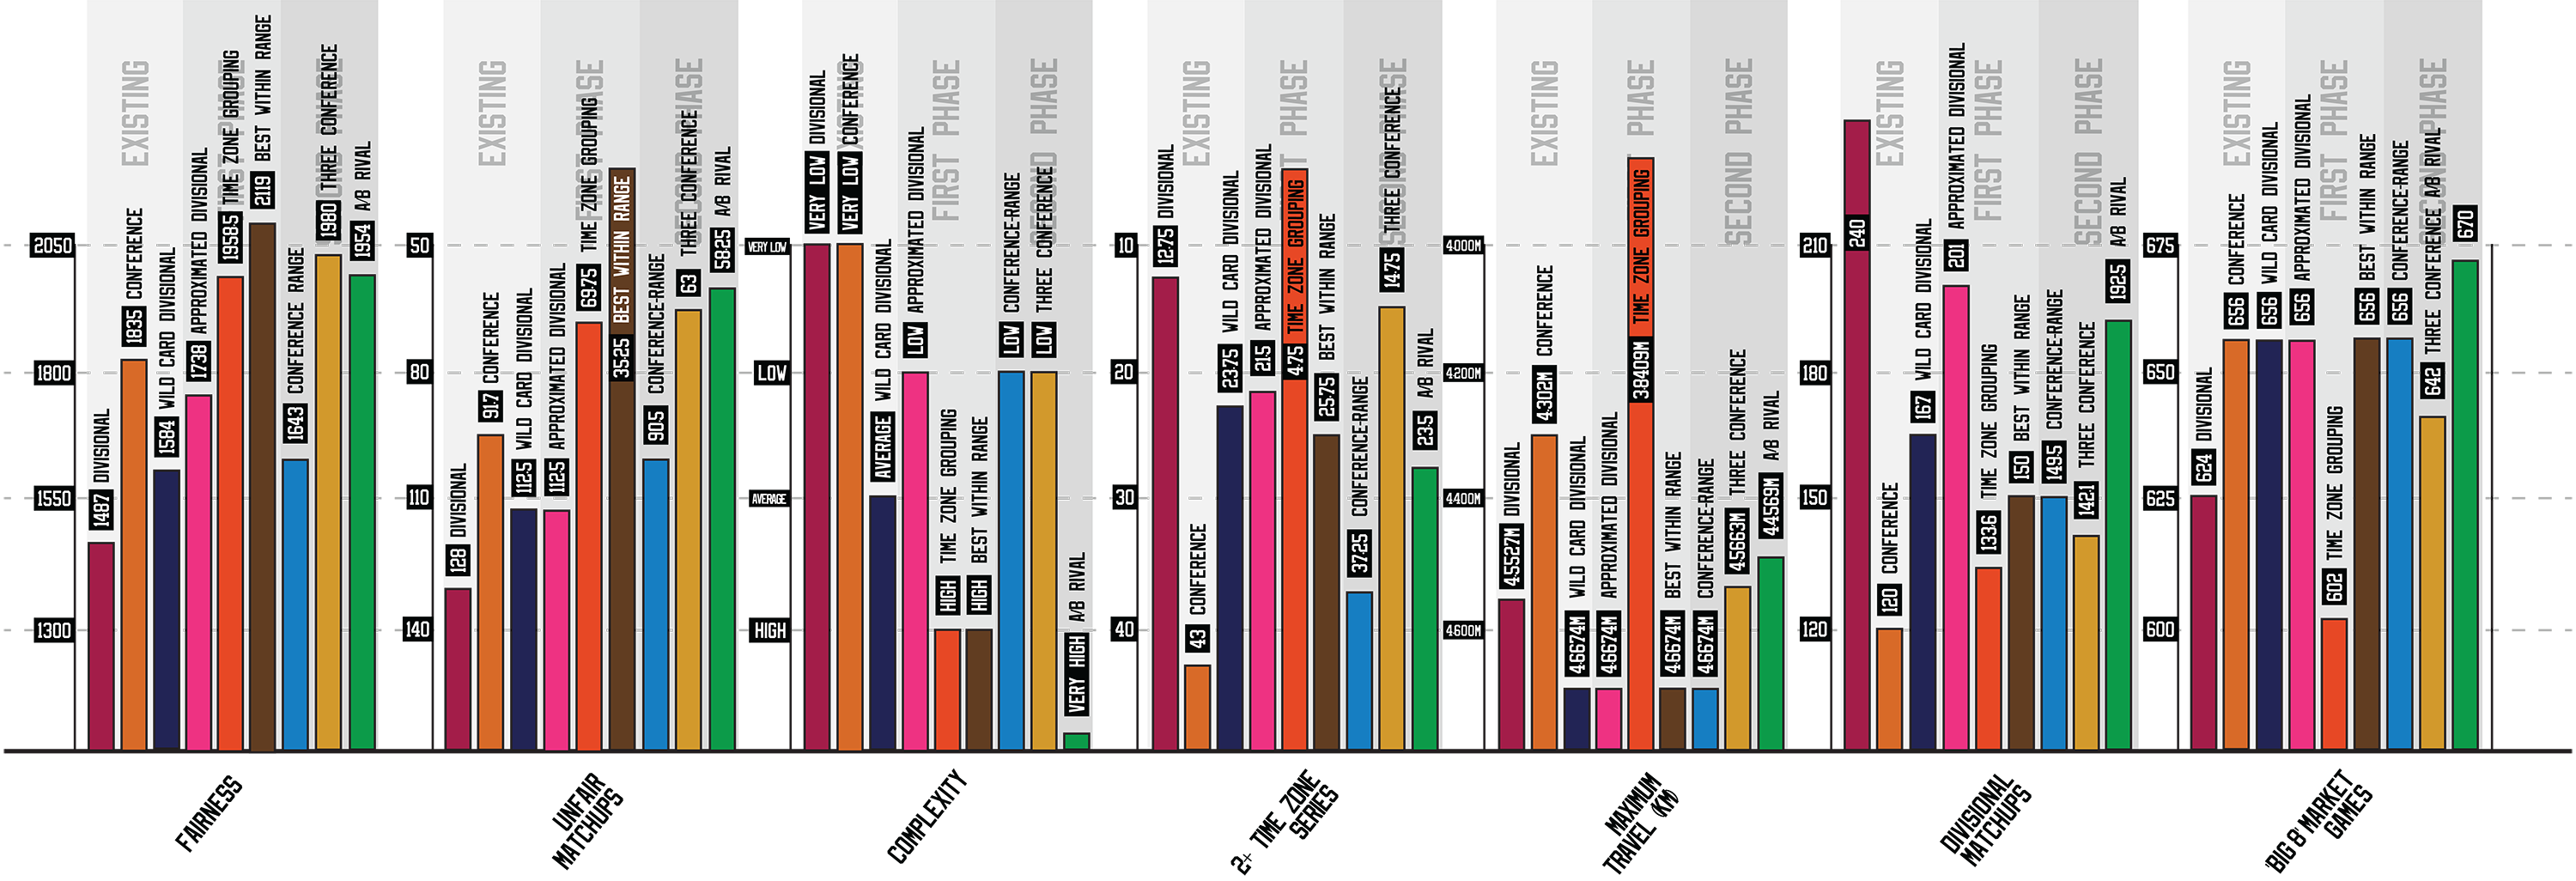
Comparisons of each format’s performance in each statistical category
In the end, every alignment and playoff format that I have proposed has specific research concerns that it addresses, but at the expense of others. As expected, there is no “perfect” solution (if there was, it would probably already exist).
The format with the lowest floor among all statistical categories measured is actually the Divisional format, and not any of my proposed formats, though that is partially due to its advantage in low complexity, and it should also be noted that three other categories score almost as low as the floor (total travel). For best coverage of all the categories, it seems Three Conference would be the best choice.
On the other hand, the best combination of high-ceiling performance among the categories seems to belong to the A/B Rival format, as its top 4 categories outperform every other format’s top 3 (other than Divisional and Time Zone Grouping, whose 4th categories fall short), while also being the most consistent format, according to the numbers on coefficient of variation. Is this acceptable, at the expense of adopting the format with the highest complexity?
Another consideration must be the formats that specialize in one or a few categories so strongly that they break the top of the charts. Would it be worth adopting the Divisional, Time Zone Grouping or Best Within Range formats to gain the massive benefits to Divisional Matchups, Time Zone Travel/Maximum Total Travel, and Fairness/Unfair Matchups, respectively? Would the disadvantages of very poor Fairness/Unfair Matchups, Complexity/Big 8 Games, and Complexity/Maximum Total Travel, respectively, not be significant enough to neutralize those advantages?
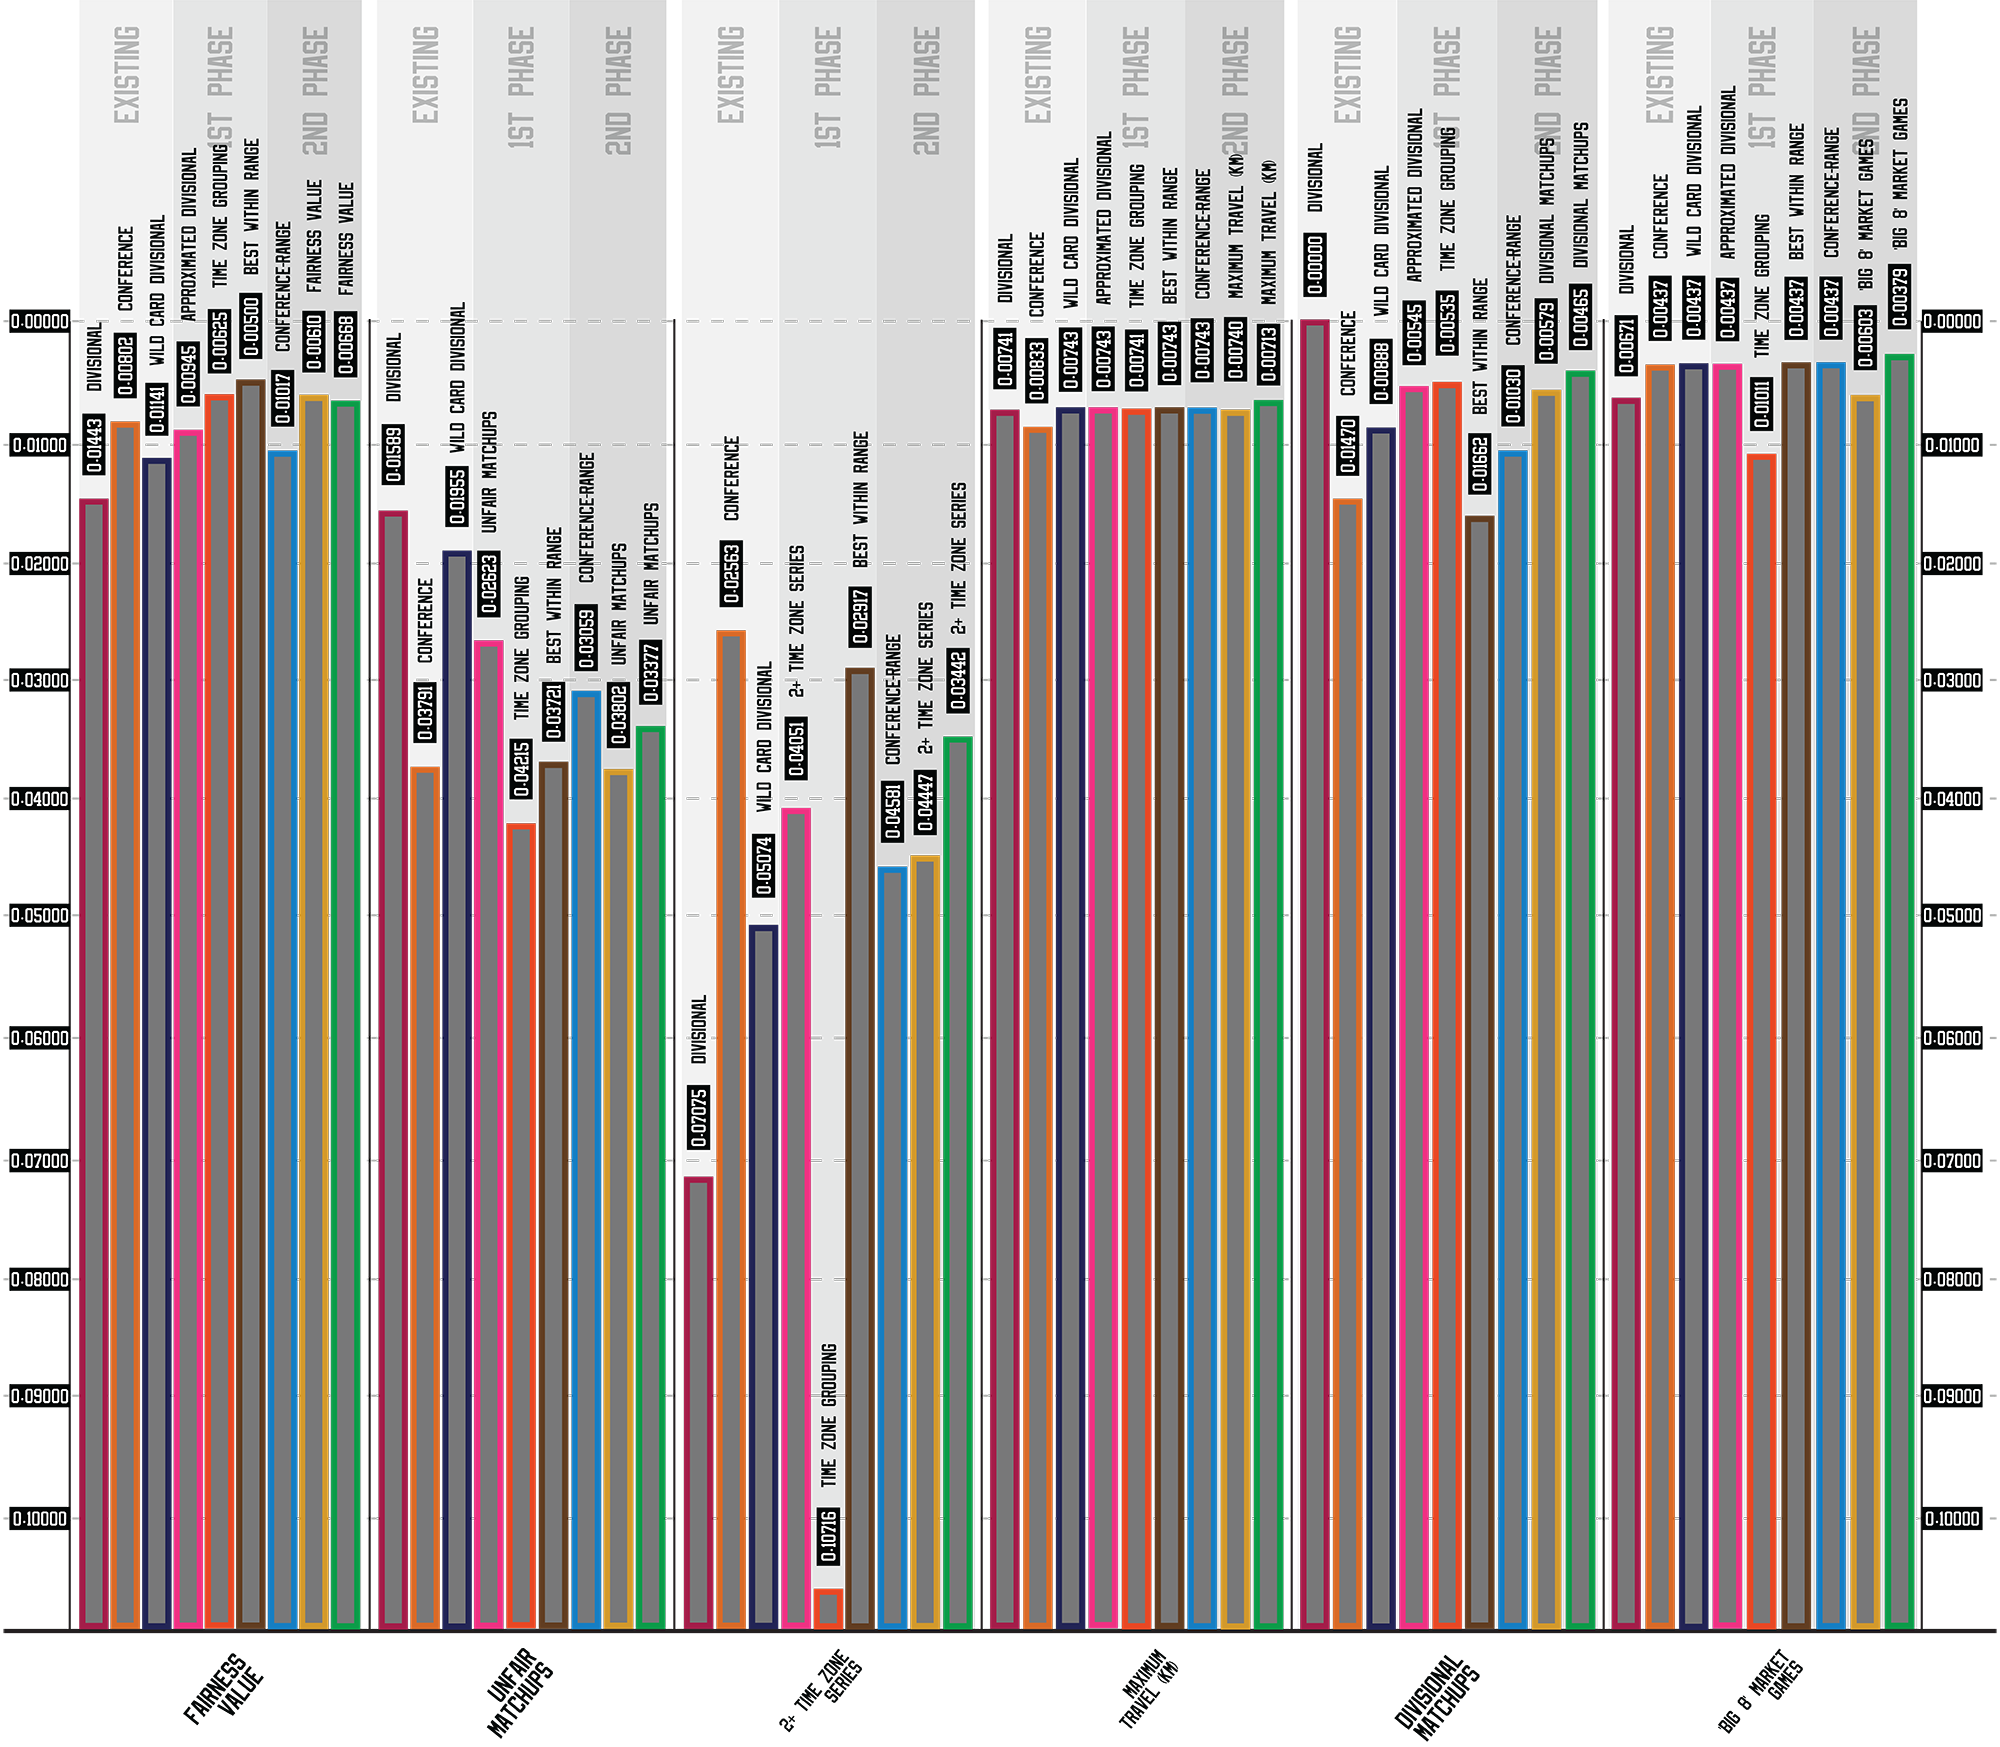
 Comparison of coefficients of variation for each format
The decision of which of these formats is best depends largely on which research concerns are considered to be the most important. If one’s goal is reducing travel as much as possible, for example, the Time Zone Grouping format must be the choice. If market support is prioritized, the A/B Rival format outperforms all other in this regard. For the best balance between fairness, reduced time zone travel, and market support, Three Conference is the best.
If complexity must be low, Three Conference would also best the Divisional and Conference formats overall, but if complexity must be very low, the choice must be Divisional if Divisional Matchups/Time Zone Travel are more important than Fairness and Maximum Travel, and Conference if not.
 Comparison of performance of each format within each statistic
One very difficult observation I have made throughout this process is that as much as I have done my best to measure and evaluate as completely as possible, there are factors at play with these formats that are not measurable, but do influence how suitable they would be for adoption.
For example, as I worked through the first and second phases, I began to see matching the regular season schedule frequency of teams playing games against each other with their respective odds of meeting in the playoffs. This is a result of noticing that without having the regular season match in this way, teams do not fairly earn their positions in the playoff format, because there could be schedule strength differences.
Most of my formats acknowledge this, but for some, it is imperfect (such as the Best Within Range format’s secondary prioritization of time zones, which is not reflected in its schedule format). Often these patterns are very difficult to seamlessly represent in a schedule format, due to limitations in numbers of teams per group, and the number of games to play against them, and the total number of games needing to be 82, as is standard in the NHL.
The degree to which a regular season schedule and playoff format tailored to have certain teams meet more frequently helps produce rivalries is also famously unknown. In most cases, it works, but in others, fan interest diminishes because of fatigue in seeing games against specific opponents. It is for this reason that the degree to which schedules and playoff formats adhere to this has fluctuated over time (Divisional –> Conference –> division-heavy schedule –> spread out schedule with 2 games vs non-conference teams –> Wild Card (semi-) Divisional). Also, to actually promote the development of rivalries, it is often beneficial to have greater variety in regular season games and playoff matchups, as novelty sometimes leads to interest in a new rival, but this does not follow measurable patterns; a beneficial blending of variety and consistent matchups versus specific opponents may be the best way to answer this tendency.
Finally, some decisions on how the regular season schedule and playoff qualification function could have significant effects on how a format is perceived to perform. It is for this reason that the Conference-Range format seems to perform so poorly compared to its peers: to prioritize rewarding teams for finishing higher within their Divisions, yet maintain relatively fair matchups within a conference-oriented format, the format artificially elevates teams finishing top-2 in their Divisions and grants them home ice advantage against teams that finished lower in their Division, but potentially with a better record (if they are from a different division that the elevated team).
Due to how I measure fairness, which automatically penalizes such scenarios (if a team has a worse record but gets I higher seed, the matchup is subtracted the difference between overall records rather than added), the Conference-Range format suffers in fairness. The structure of the format also results in higher time zone travel than average but does not automatically punish teams that win their Divisions by having them face teams outside their Division when the other teams in it are not strong. All of this combined leads to the format appearing to perform poorly, but its tendency to match up teams with worse records but higher positions in their Division with teams in the opposite situation can be considered fair as well, in a way that cannot be measured in a satisfactory way.
Comparison of coefficients of variation for each format within each statistic
This leads to my personal choice in which format should be adopted by the NHL: the A/B Rival format. While I am certainly biased, as its creator and by virtue of it being the most creative of my formats, I genuinely believe that the change in how teams compete with each other for playoff spots, combined with the increased market support and likely interest in games throughout the regular season and playoffs, would lead to much greater success for the NHL.
Having each team compete directly for playoff spots with only 3 other teams, matching the higher numbers of head-to-head games, would make the A-Rival games carry a greater importance than is typically seen in today’s divisional games, which involve 7 others teams in semi-direct competition for playoff spots.
It can accomplish this without significant losses to fairness, unfair matchups, time zone travel or maximum total travel, in fact, all of these statistical categories are showing improvements in this format compared to the Wild Card Divisional format. The only cost would be to adopt a format that is highly complex, and would cause avid fans, not just casual fans, to struggle to follow how it works. The merits to going this route are certainly debatable, as fan engagement in the NHL’s inner workings is very valuable.
The one certainty, in my mind, is that the NHL could definitely improve upon the current format in particular, but even all of the past formats did not have nearly as much though put into them, and improvements are a definitive possibility that should be explored.
All logos © National Hockey League or respective owners, used for purpose of graphic aid only
Ice background © Artsfon wallpapers
- National Hockey League (Independent Endlessly Detailed Hobby Project)
- 2010-present