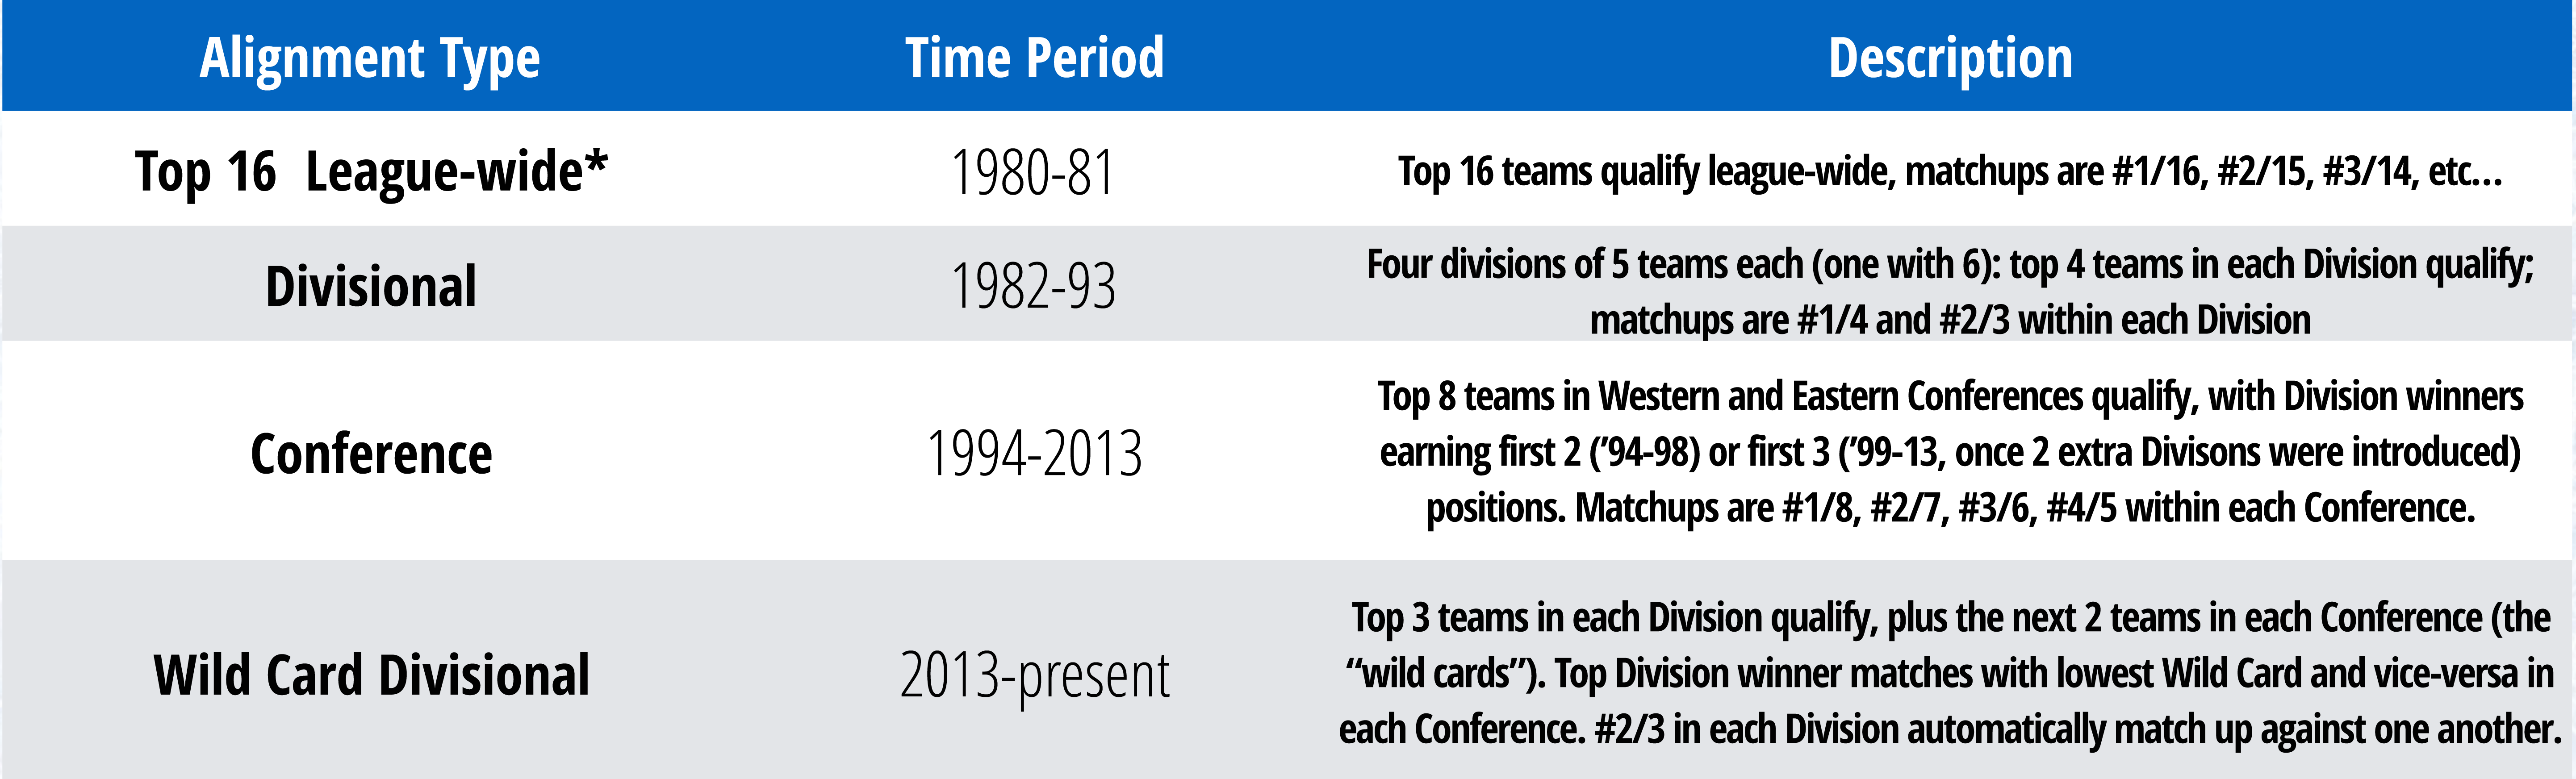
NHL Alignment and Playoff Formats of the Past
To show some of the history behind the NHL’s alignment and playoff formats prior to present day, and by extension, show how some of the issues have evolved over time, I will demonstrate and exemplify three formats that I compare to in my alignment proposals: the Divisional format, the Conference format, and the current “Wild Card Dvisional” format:
*The Top-16 format will not be examined in detail. All one needs to know about it is that it was the most fair possible format, but did not take into consideration time zone travel or rivalry prioritization at all. It also balanced the schedule among all teams in the league, leading to excessive travel, as teams like Montreal and Los Angeles played the same number of games per year as each played Quebec and Vancouver, respectively.
Some of the playoff matchups that occurred in just two years of this format: Philadelphia/Edmonton, Buffalo/Vancouver, NY Islanders/Los Angeles, St. Louis/Pittsburgh, Buffalo/Chicago, Montreal/Minnesota, NY Rangers/Los Angeles, Edmonton/NY Islanders, etc…
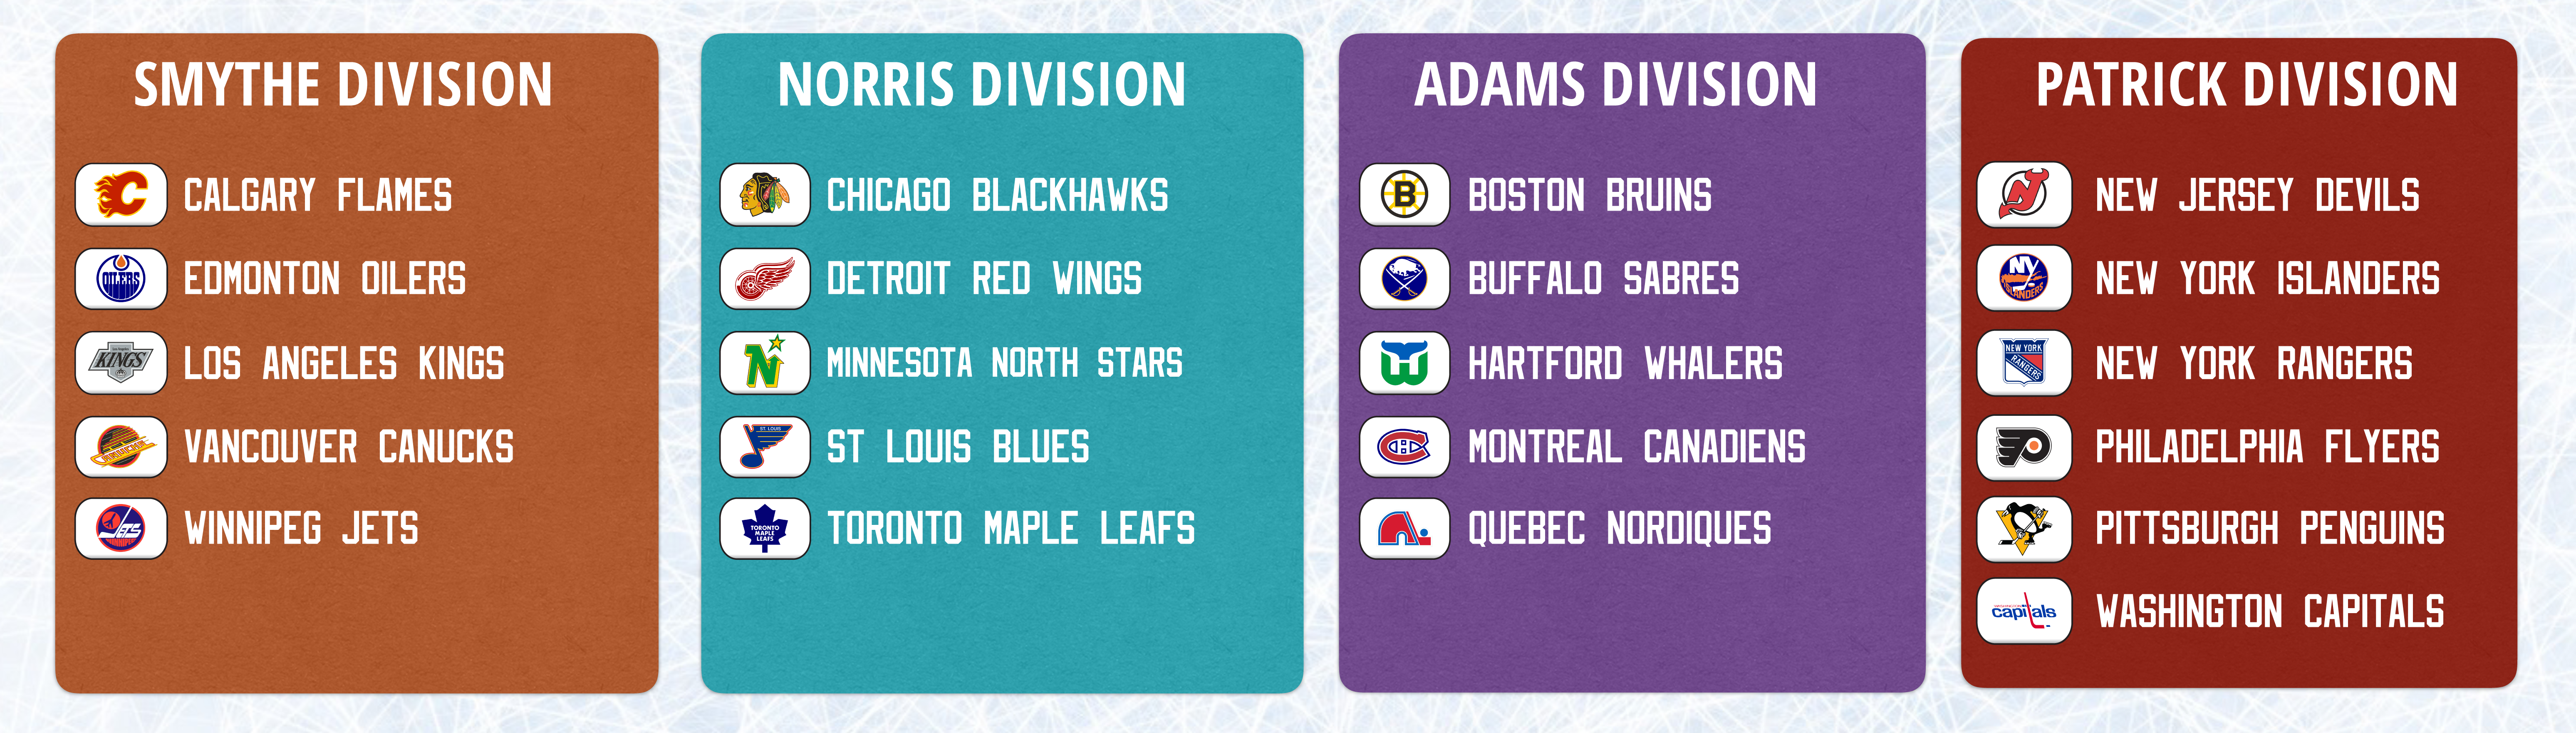
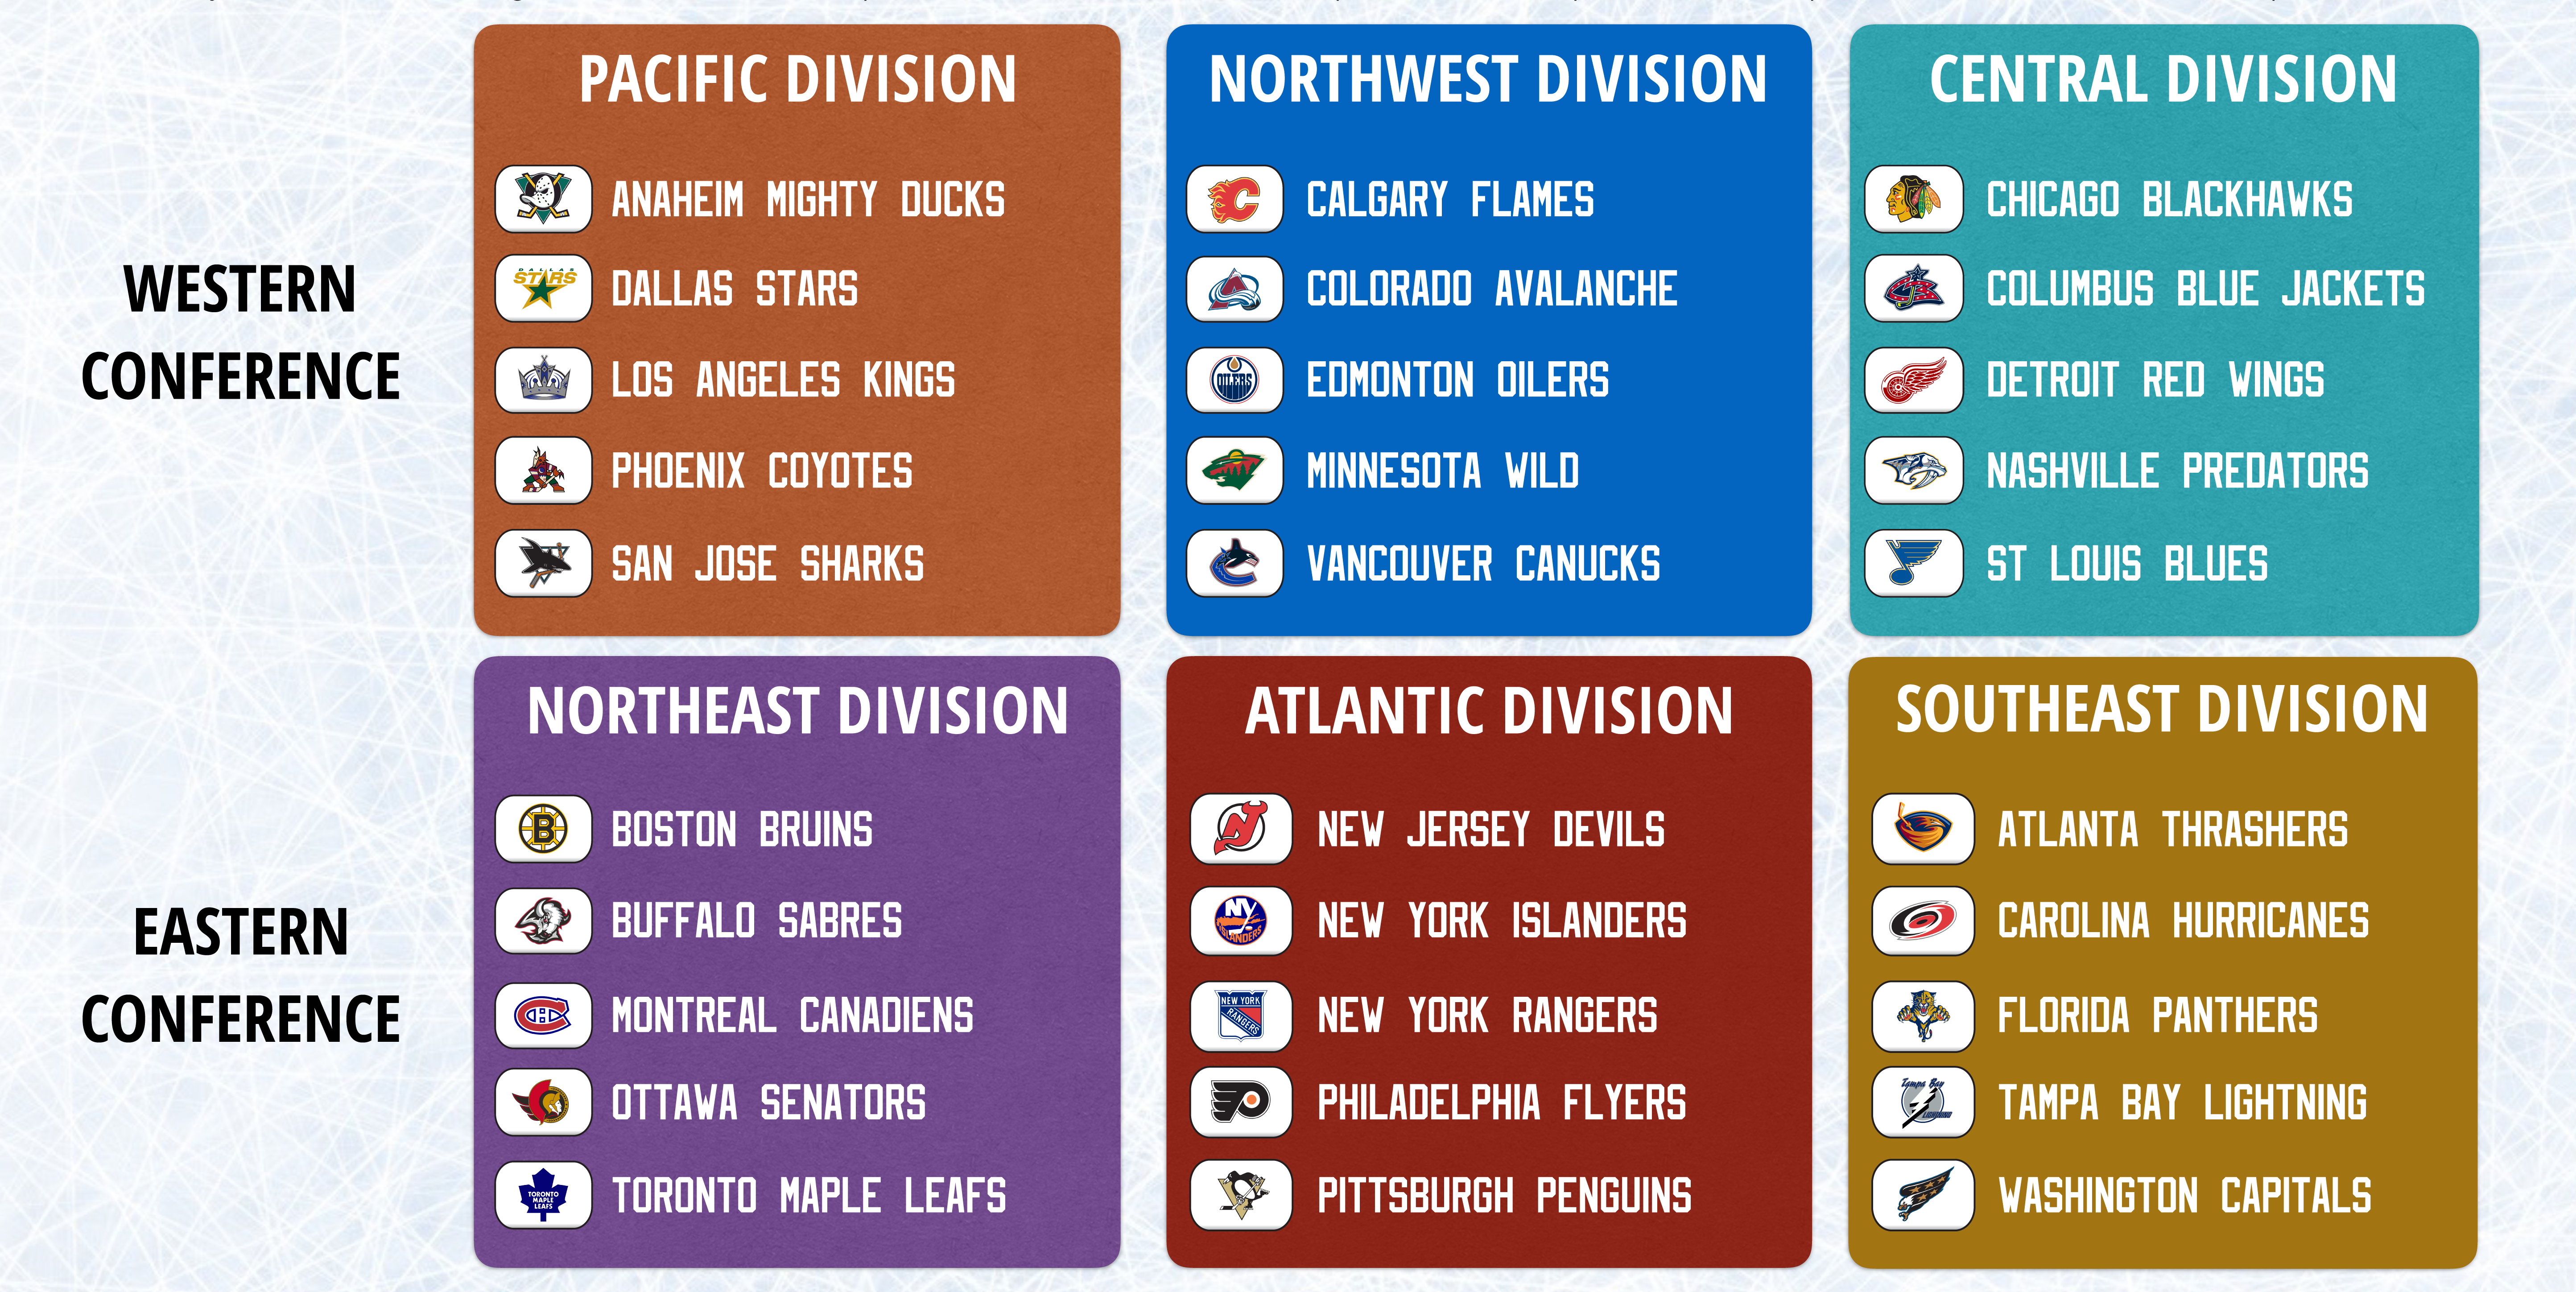
Here is a look at the current and former locations of NHL teams during this period. This should be kept in mind when seeing the Division alignment and playoff formats of past years (only considering defunct teams that were active post-1982):
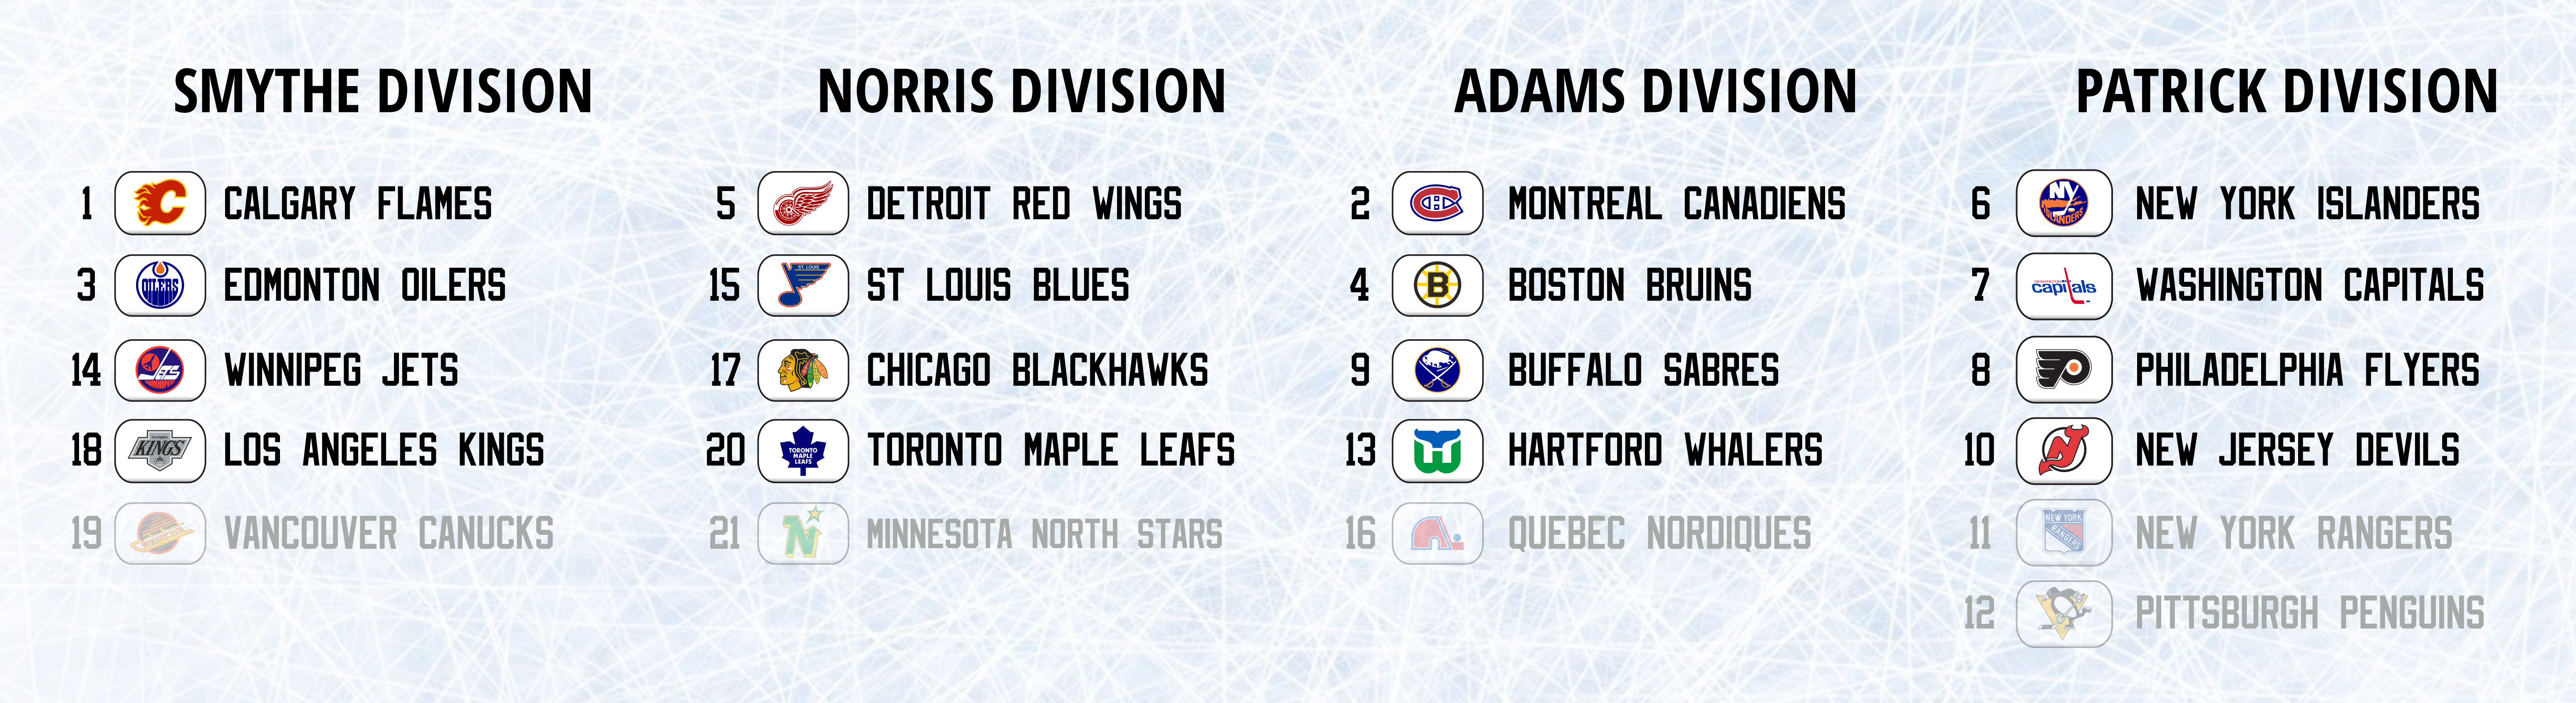
Division Alignment/Playoff Format (1982-1993)
The Divisional format allowed the top 4 teams from each Division (Smythe, Norris, Adams, Patrick) to qualify for the playofffs:
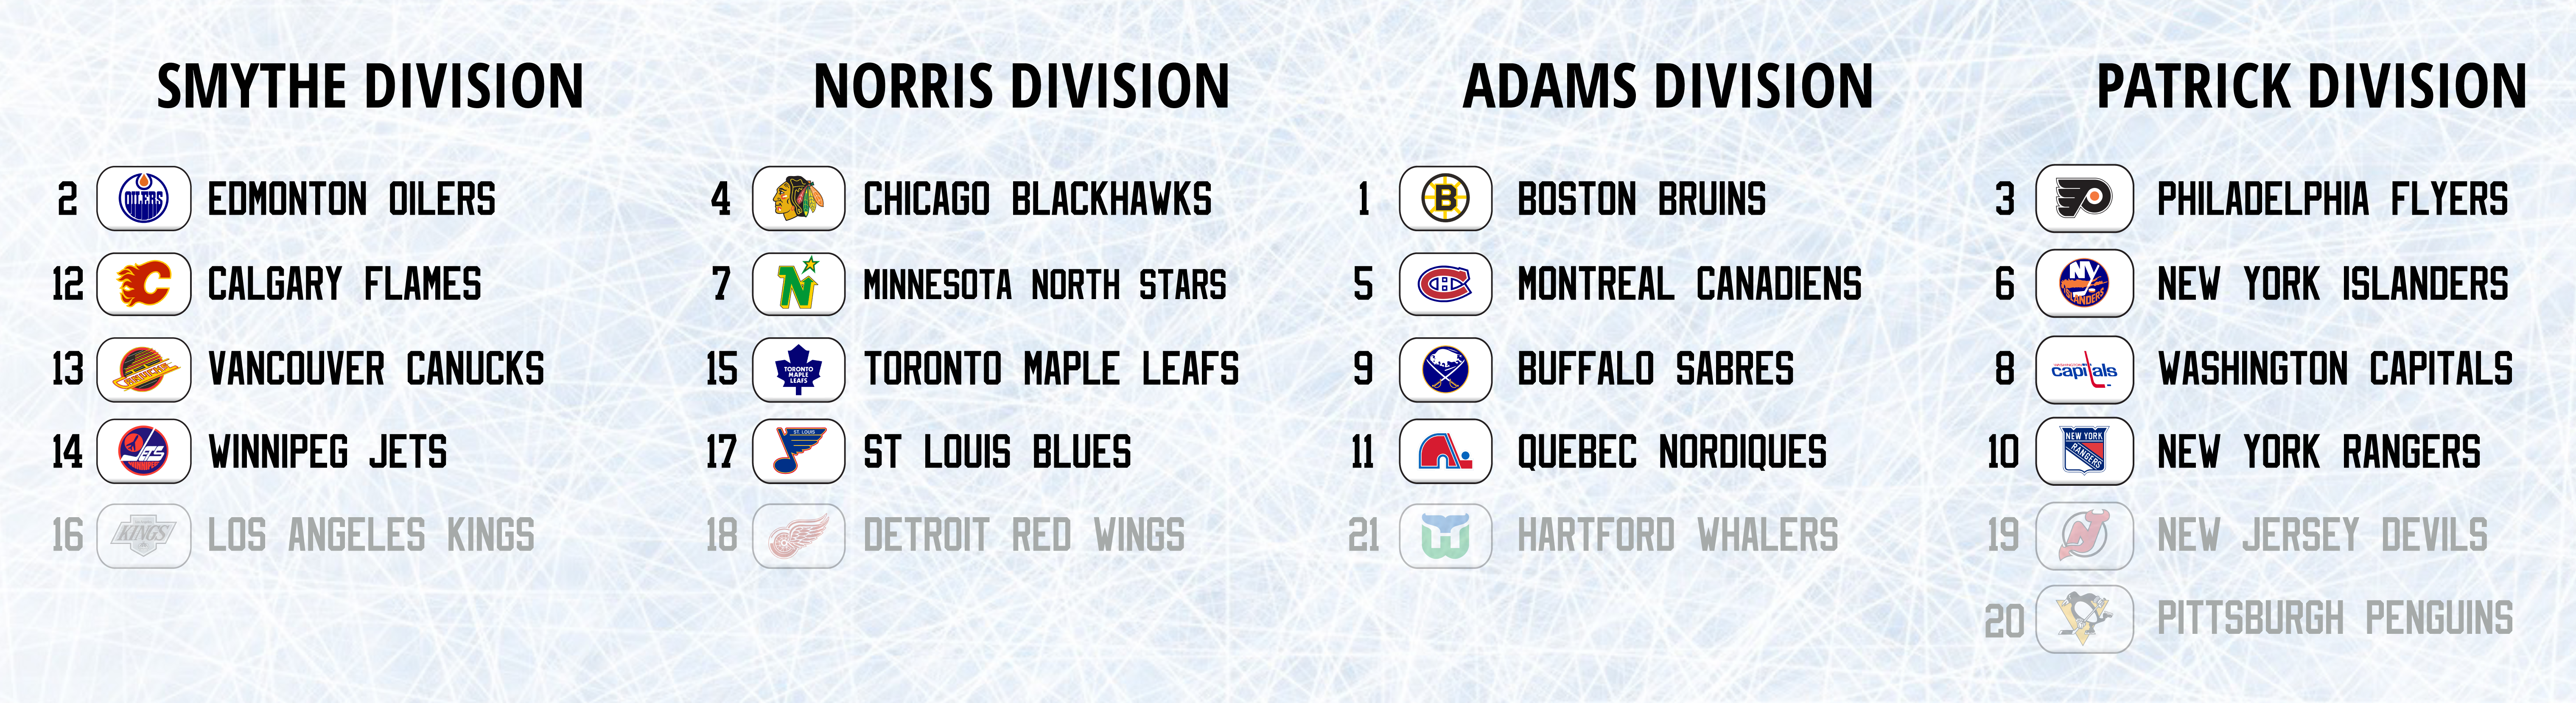
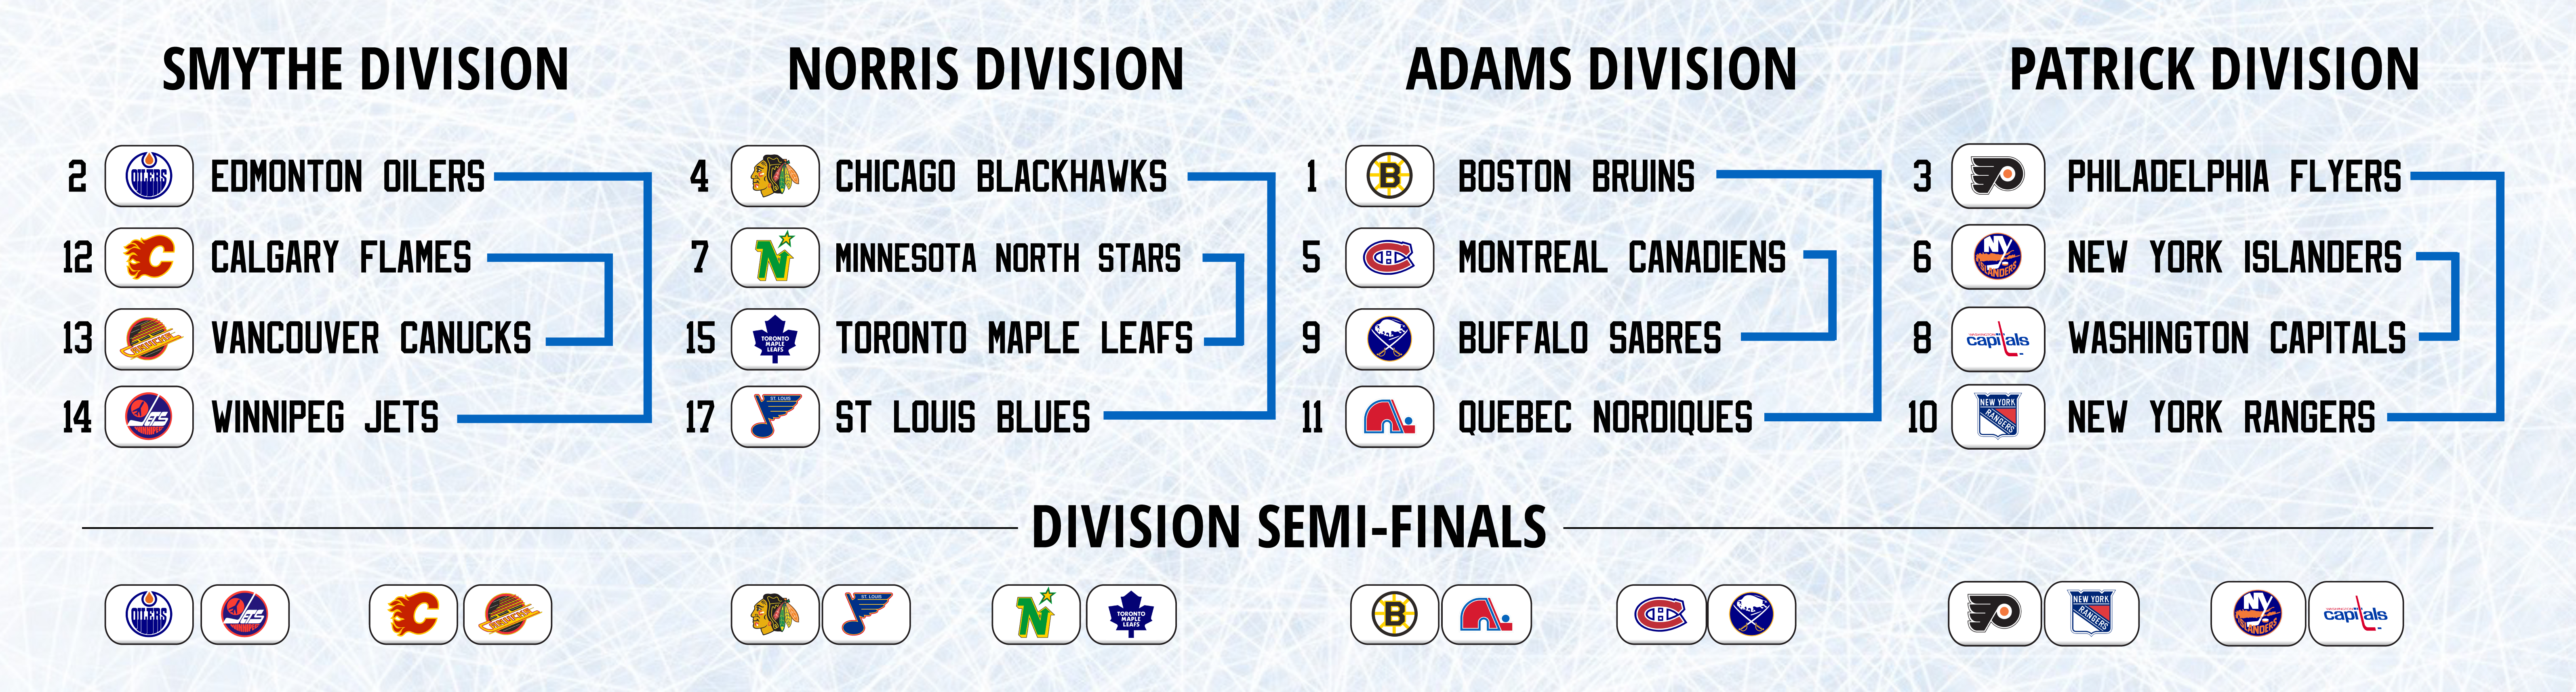
To exemplify a “normal” playoff year under this format, here is the 1983 playoff year, with each team’s league-wide position indicated to its left:
Although the format is simple, there are some obvious flaws, even in this “normal” year:
The Eastern divisions are significantly stronger: for this reason, while #12 Calgary gets home ice advantage in the Pacific’s second place, #8 Washington find themselves on the road against #6 NY Islanders.
Similarly, while #4 Chicago draws #17 St. Louis, #3 Philadelphia (a higher seed) draws #10 NY Rangers.
Los Angeles misses the playoffs despite being #16, while #17 St. Louis earns a spot. This is not much of a problem, but the disparity is often much larger.
In the Division Finals, #1 Boston draws a harder matchup (#9 Buffalo) than #2 Edmonton (#12 Calgary) and #6 NY Islanders (#10 NY Rangers).
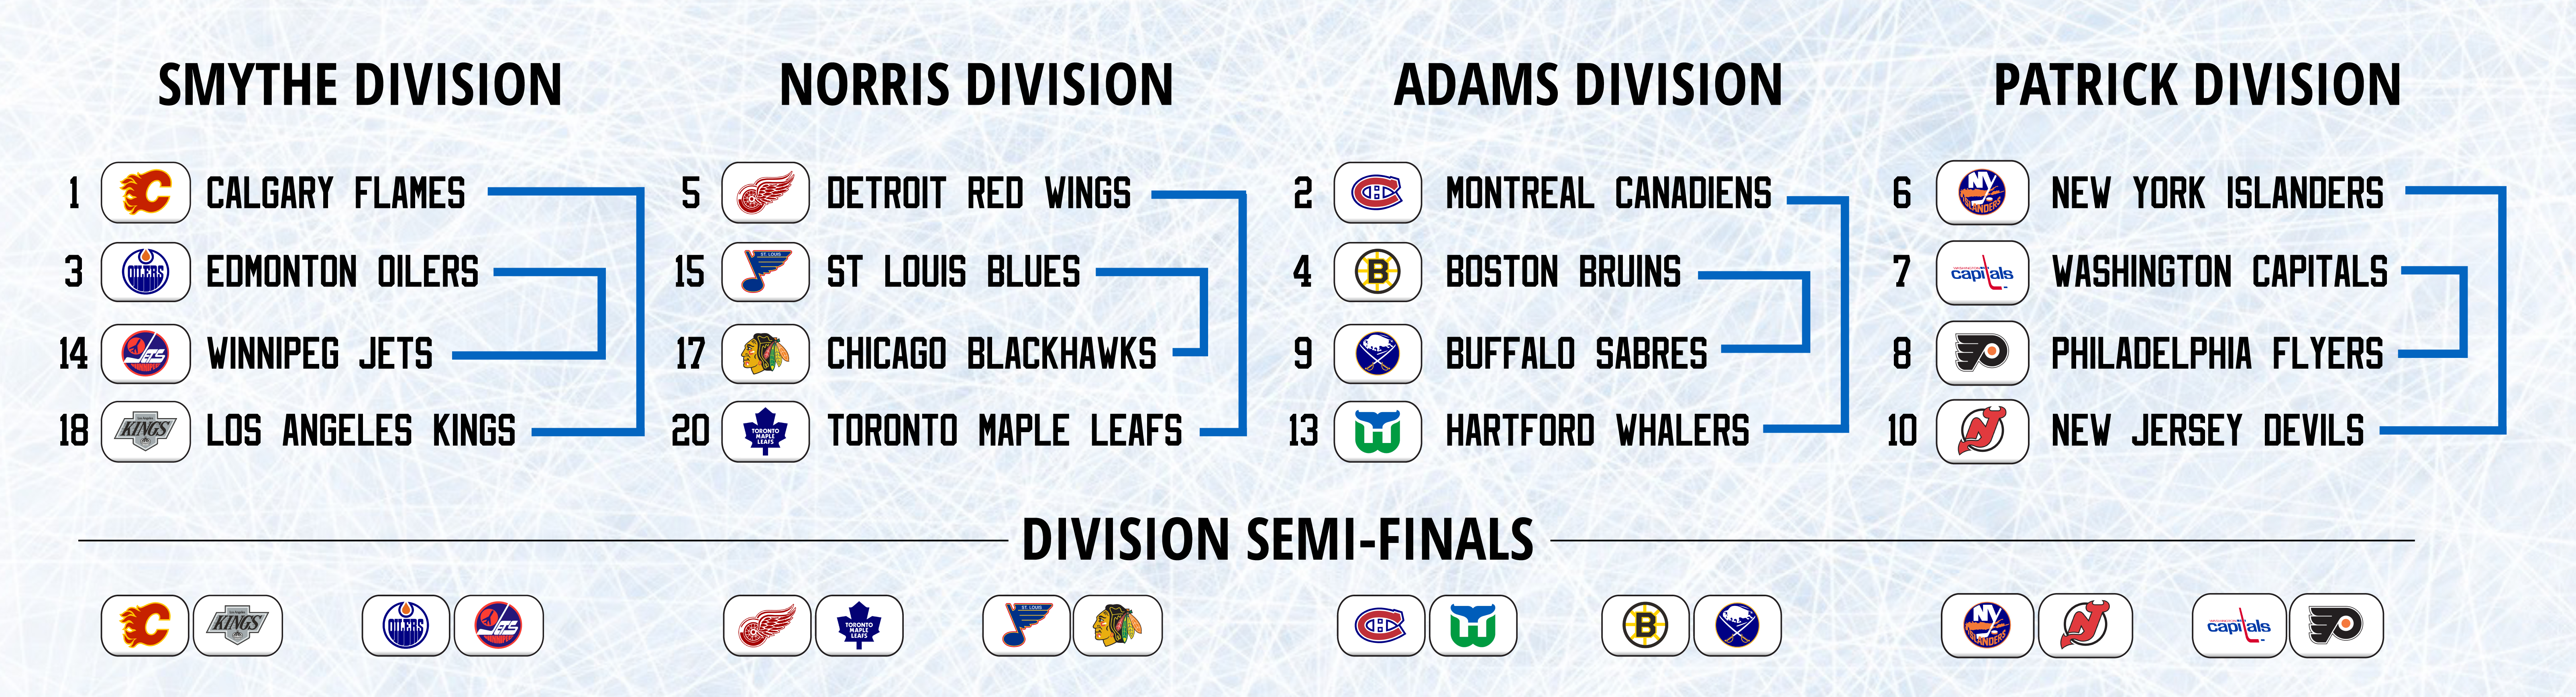
One further example, to show some of the more serious issues of this format: the 1988 playoff year:
Here, there is a huge disparity in the power balance between divisions that has allowed #20 (out of 21!) Toronto to qualify over #11 NY Rangers and #12 Pittsburgh. The debate on this would centre on whether an 11th place overall team that happens to be 5th in a very strong division deserves to qualify or not.
In the Division Finals, the #1 team (Calgary) gets the hardest matchup (standings-wise), while #5 Detroit gets a significantly easier matchup than any other team, even Washington, who is second in their Division. Many of the issues in this time period were caused by virtue of allowing 16 out of 21 teams to qualify for the playoffs.
A more modern hypothetical example follows this one to show how this might look today (with 2010’s 30 teams, rather than 21).
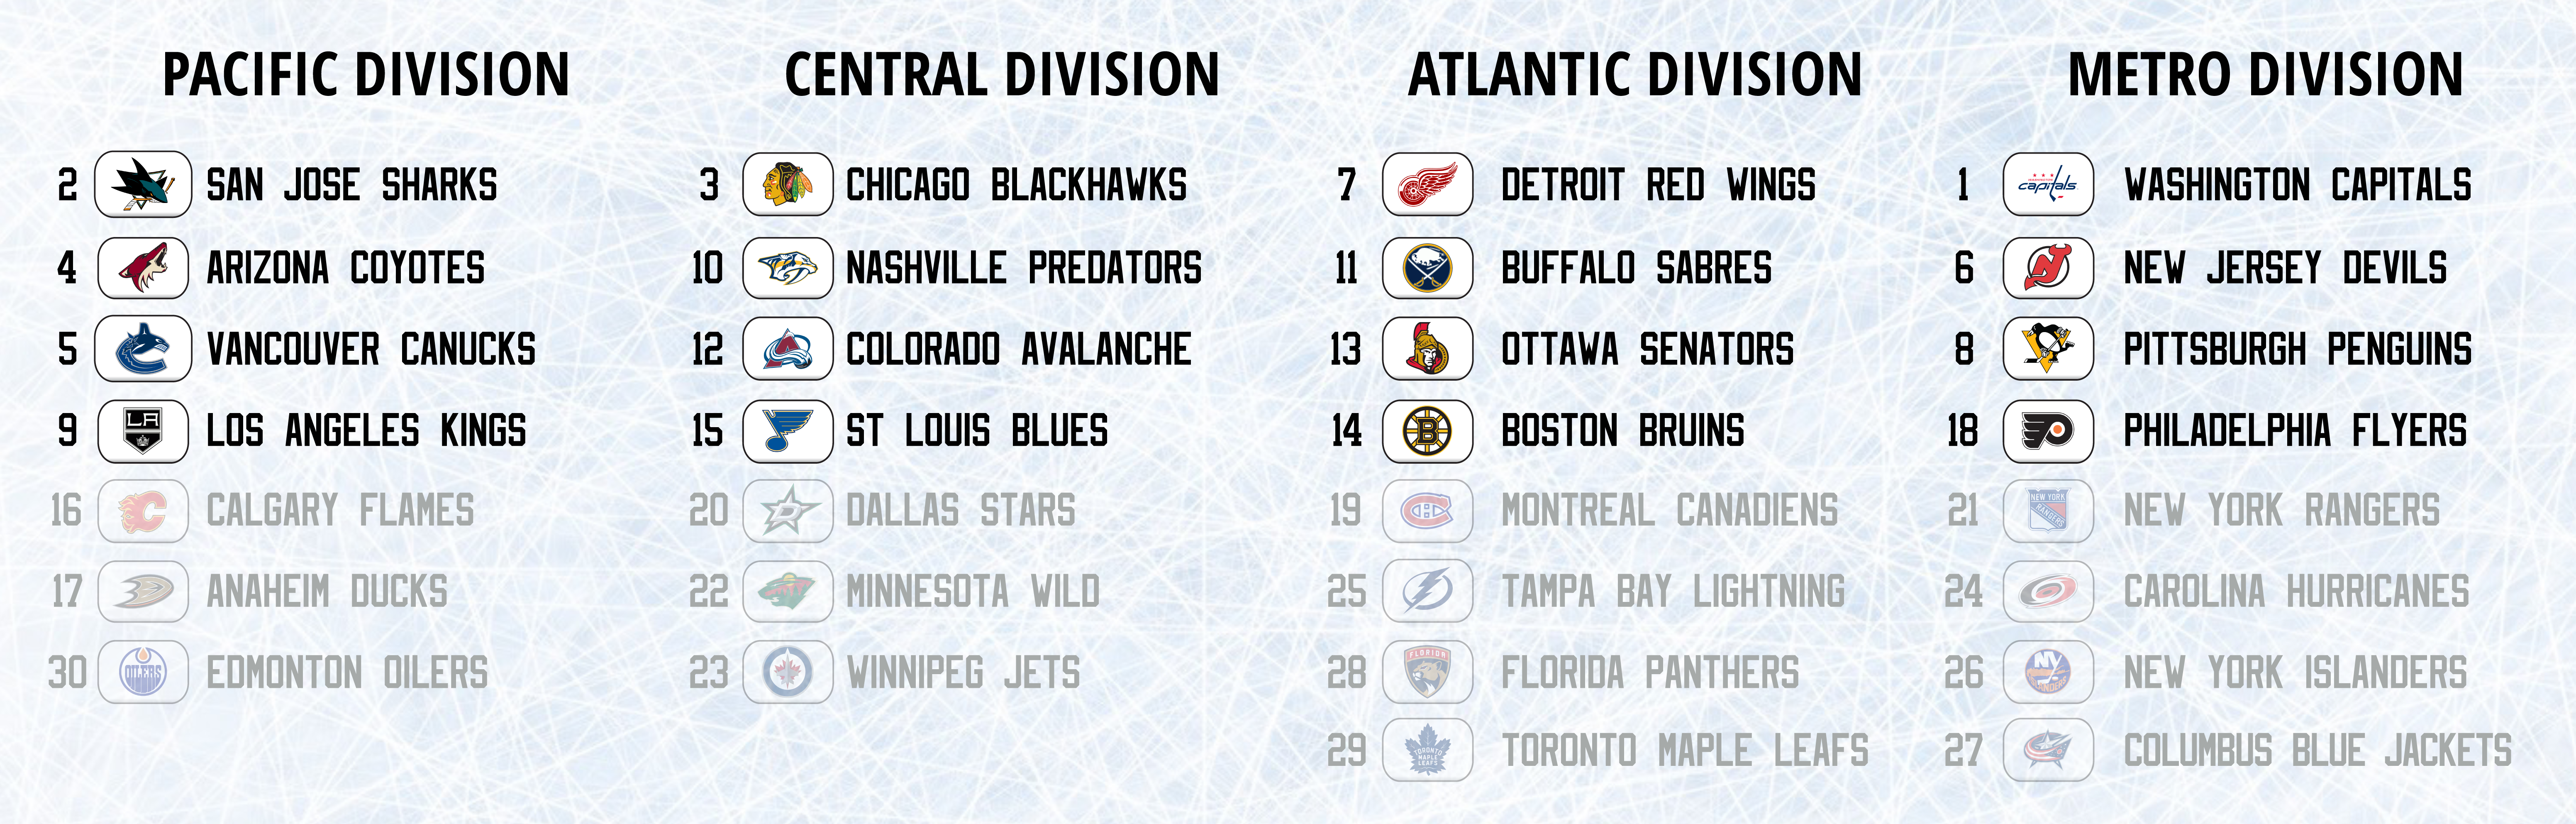
Looking only at the format as it was in the 1982-1993 time range does not show the complete story, since a divisional format today (as of 2017) would look more like this:
Here is the 2010 NHL playoff as an example, using the Divisional alignment format instead of the Conference format used at the time:
This is not entirely accurate, since the alignment was completely different (3 divisions of 5, Detroit and Columbus were in the West, Winnipeg was still the Atlanta Thrashers and in the East, etc) and that would have affected the schedule, game results and ultimately, the standings and playoff positions. However, this arrangement is certainly possible, giving an impression of the relative strength of each team at the time.
The result is a series between #4 and 5, a series between #11 and 13, and #18 Philadelphia qualifying over #16 Calgary. In comparison to the Conference format, while #19 Montreal also qualified over #15 St. Louis, the matchups were fairer, but there were 3 matchups in the first 2 rounds that were 2 or more time zones apart (Coyotes/Red Wings, Sharks/Red Wings, and Blackhawks/Canucks). The Divisional format would have prevented any such matchup from occurring until the Conference Finals.
In the modern NHL, each Division has at least 7 teams, thus better competitive balance, fewer huge disparities in strength between Divisions, and less repetition in playoff matchups. The latter, while good for rivalries, can get tiresome if overdone (during the original Divisional era, Boston and Montreal met 9 consecutive times in the playoffs between 1984 and 1992).
Finally, this structure post-Seattle expansion cannot prevent at least one case of a Division spanning 3 time zones: currently, Arizona is planned to move to the Central Division, but from March to October, the state is effectively in the Pacific time zone as a result of not switching to daylight savings time. Further, the travel incurred on Arizona by having so many distant division rivals instead of 4 of the closest 5 teams to them as is the case by being aligned in the Pacific is excessive. The only way to remedy this would be to either split the Alberta teams up and moving one to the Central (which would neutralize one of the biggest rivalries in the league), or move both Alberta teams to the Central and Colorado to the Pacific (which would neutralize two of the biggest rivalries in the league, between the Alberta teams and Vancouver).
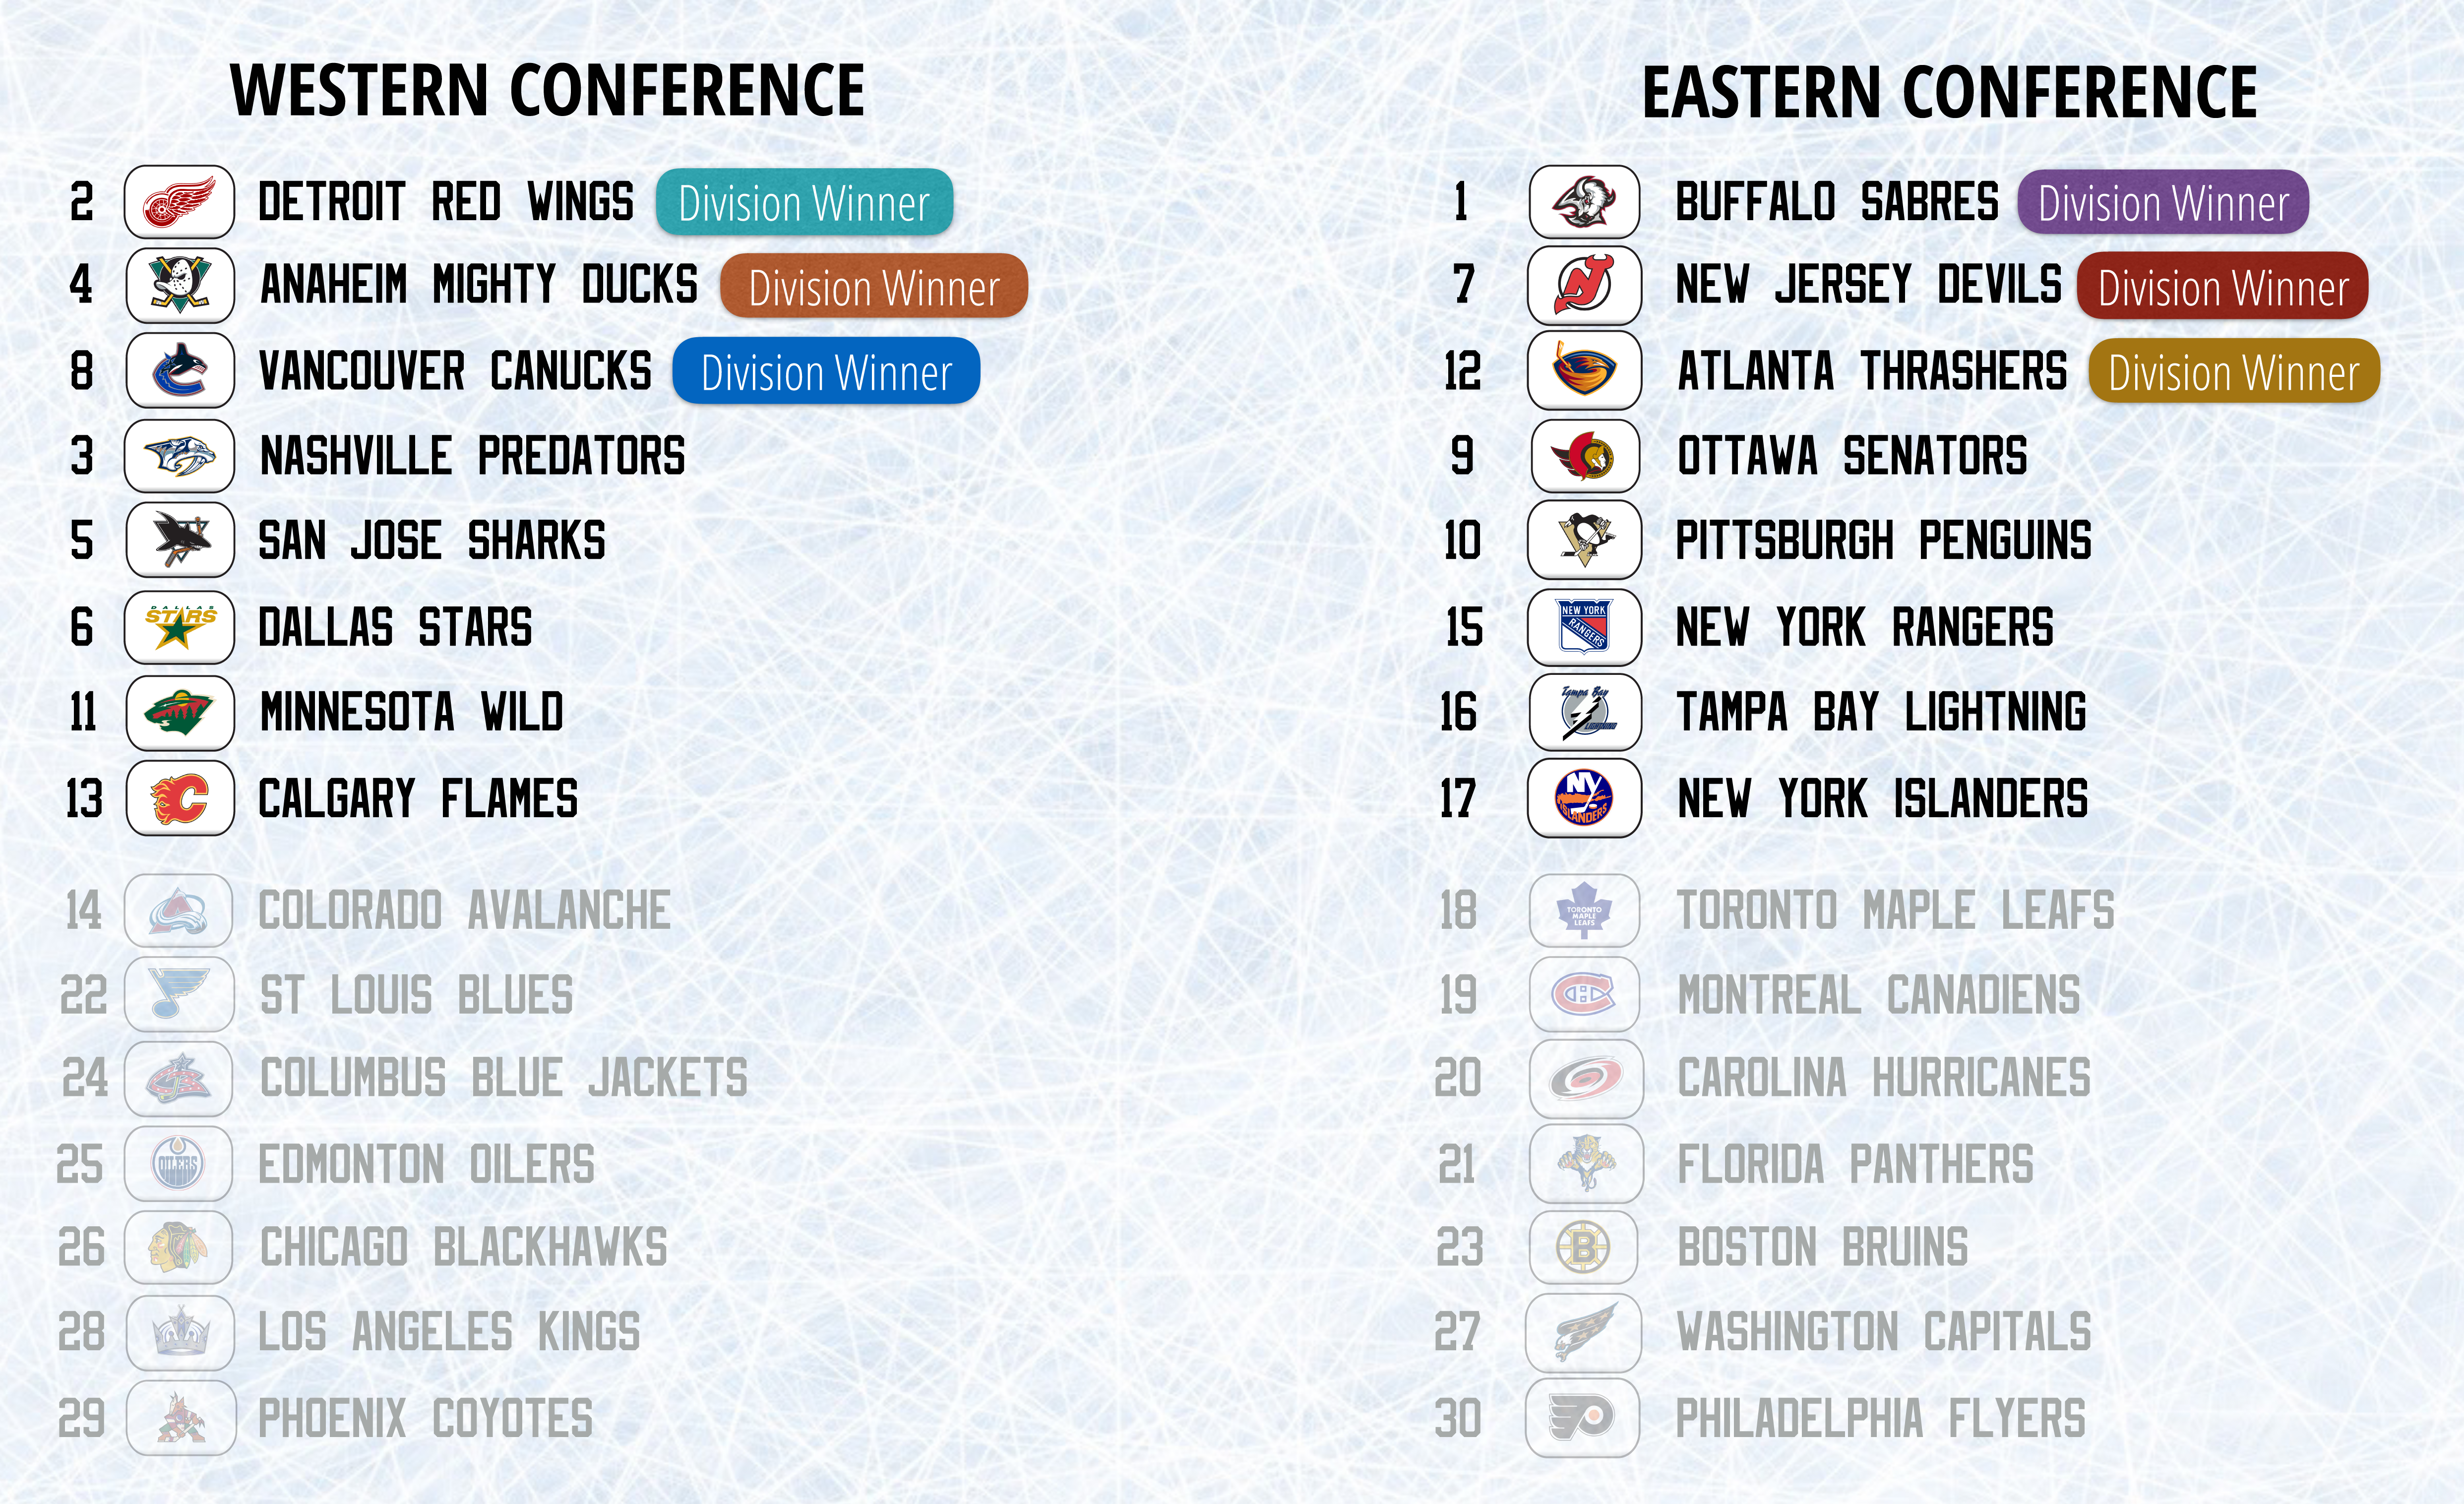
Conference Alignment/Playoff Format (1994-2013)
The Conference format grouped teams into the two conferences (Western and Eastern) and had teams qualify for the playoffs if they finished within the top 8 teams in their Conference. Additionally, the Division winning teams all earned the top 2 (when there were 2 Divisions per Conference) positions, and top 3 (once there were 3 Divisions per Conference).
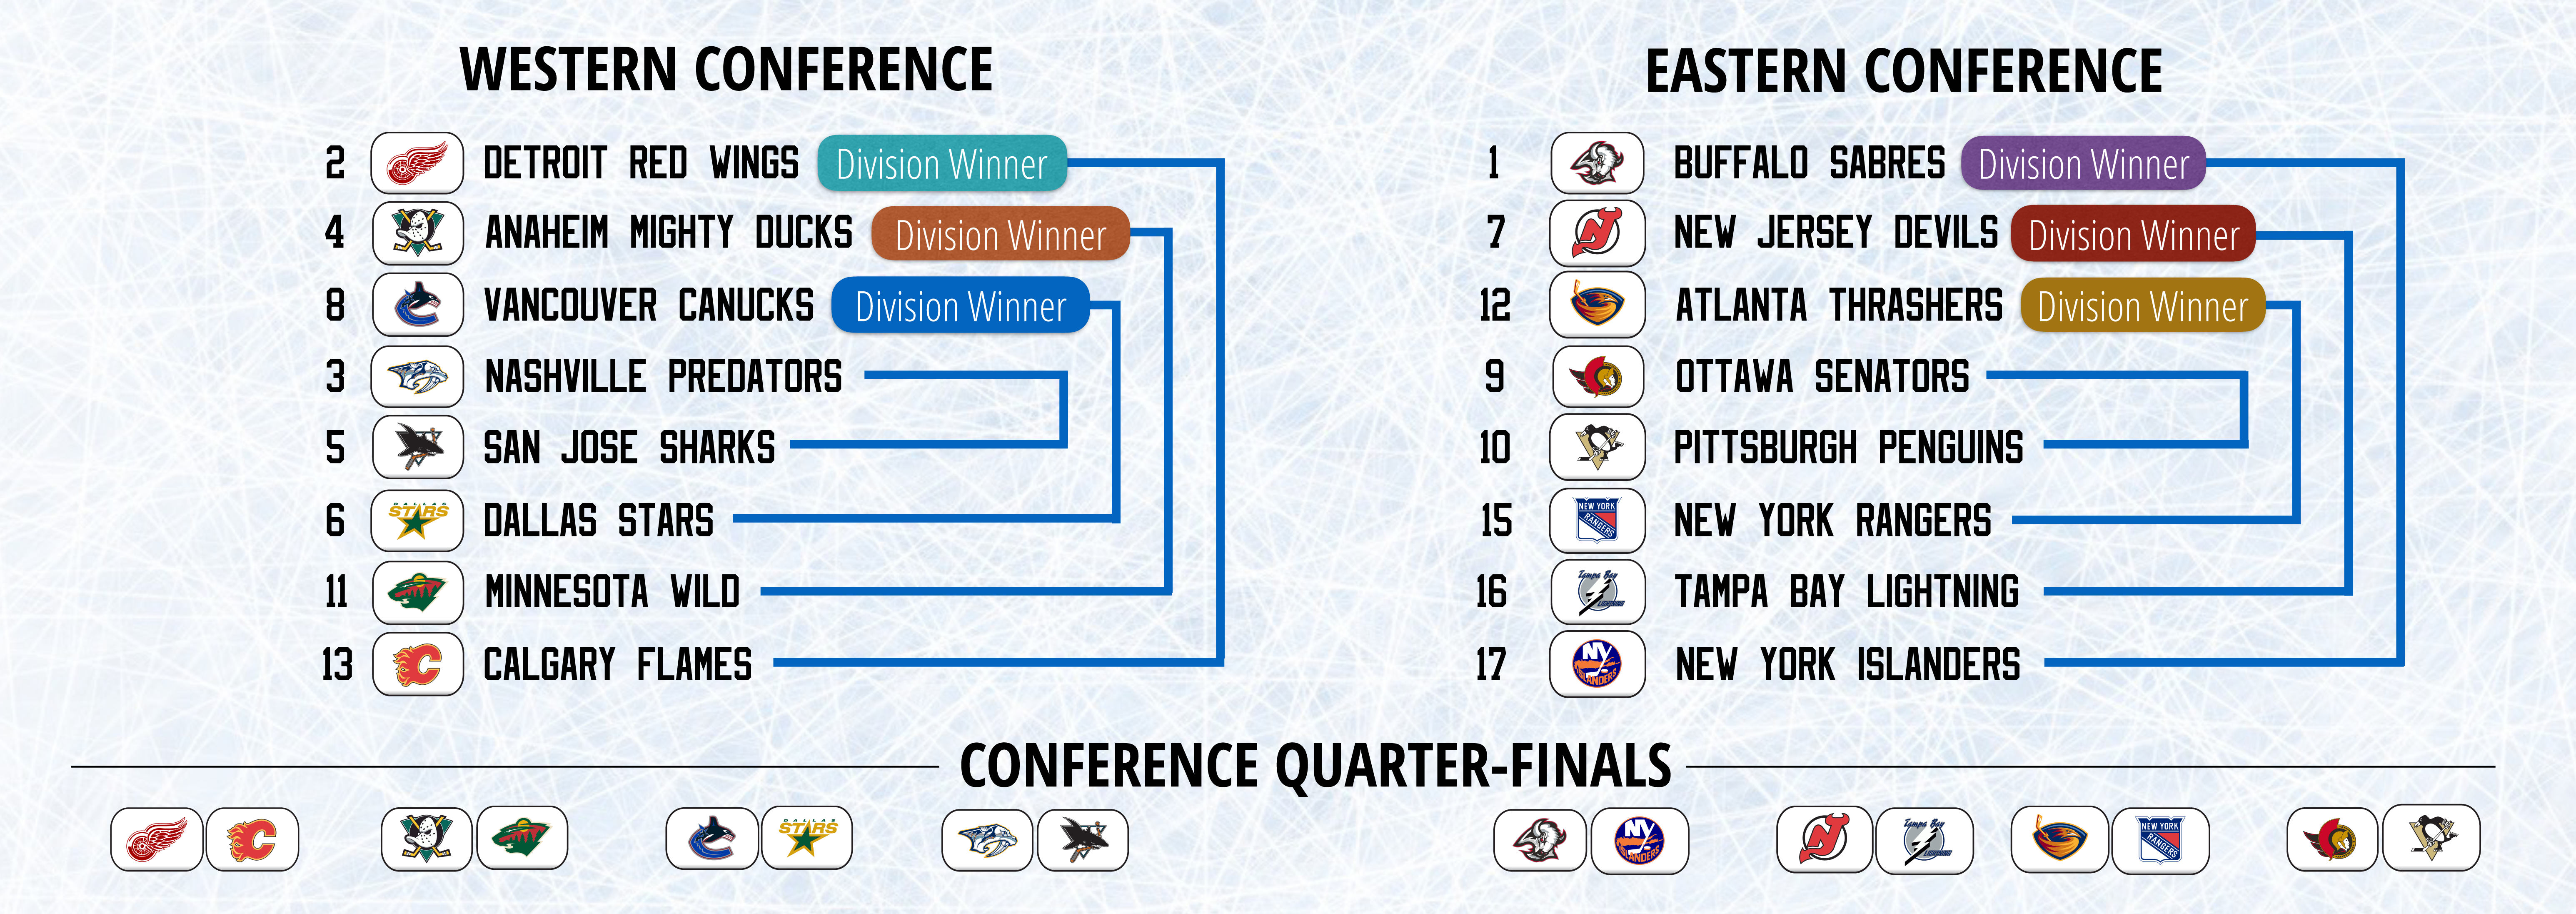
Here is an average example playoff year: 2009. Each team’s league-wide position is indicated to the left:
This shows much fairer matchups on the whole, and not only due to there being more than 21 teams. However, the conference divide allows #17 Anaheim to qualify over #14 Florida.:
There are still issues with time zone travel that the Divisional format does not have: with no restrictions on matchups within the Conference, the Western playoffs tend to have several Pacific-Central, or even Pacific-Eastern matchups: here, we have Vancouver/St. Louis, Detroit/Anaheim, and Vancouver/Chicago in the first 2 rounds. Finally, by virtue of winning their Division, #7 Vancouver gets home ice advantage in their series against #6 Chicago – this is not a great disparity, but worse examples are rampant in this format.
Here is a second example, this time demonstrating when the issues in this format are more of a problem: the 2007 playoffs:
In this year, there are a number of problems, directly attributable to the format. Many matchups were between teams 2 or more time zones apart in the first 2 rounds (Detroit/Calgary, Anaheim/Minnesota, Vancouver/Dallas, Nashville/San Jose, Detroit/San Jose). This was a very time zone travel-intensive playoff year.
Additionally, the matchups are not fair: #3 overall Nashville, by losing the Division, ends up the #4 seed and draws #5 (overall) San Jose, while #8 Vancouver, by being a Division winner, gets home ice advantage over #6 Dallas.
In the East, #12 Atlanta is a Division winner and draws #15 NY Rangers, while #9 Ottawa draws #10 Pittsburgh. If Atlanta had won their 1st Round series, and had New Jersey lost, Atlanta would have had home ice advantage against Ottawa in the next round. Finally, #14 Colorado does not qualify for the playoffs over #17 NY Islanders.
Two major problems have plagued the Conference format throughout its existence:
[1] The Division alignment has always ignored the importance of limiting time zone travel: prior to the 1999 realignment, the Phoenix Coyotes spent several years aligned in the Central Division with Central and Eastern teams, despite being effectively a Pacific team. After the 1999 realignment, the Pacific Division featured Dallas aligned with all three California teams and Phoenix, making every road team in the Divisional games have 2+ time zones worth of travel and inappropriate TV start times. Similarly, Minnesota as a Central team shared a Division with the Vancouver Canucks, a Pacific team. The mathematical nature of having 15 teams aligned into 3 Divisions of 5 was obviously tempting due to its symmetry, but it was never an appropriate alignment due to the time zone dynamics at play.
[2] Teams in the Conference format never fairly earned their spots in the standings come playoff time. This is because the schedule was heavily weighted towards Divisional play, rather than balanced throughout the Conference, so a Conference seed was subject to schedule strength effects. In other words, if the Calgary Flames finished as the 6th seed, but their Northwest Division was significantly weaker than the Pacific and/or Central Divisions, their place at 6th may be artificial by virtue of having an easier schedule than their peers. For this reason, all of my simulations of the Conference format, and the statistics associated with it, operated under the assumption of a balanced schedule for each Conference, and the absence of Divisions. The schedule in this scenario would be 4 games against Conference Rivals (equalling 60 games), and 22 games against non-Conference opponents, which would mean a rotating 16 season schedule of having either one or two games per year against each team in the opposite Conference.
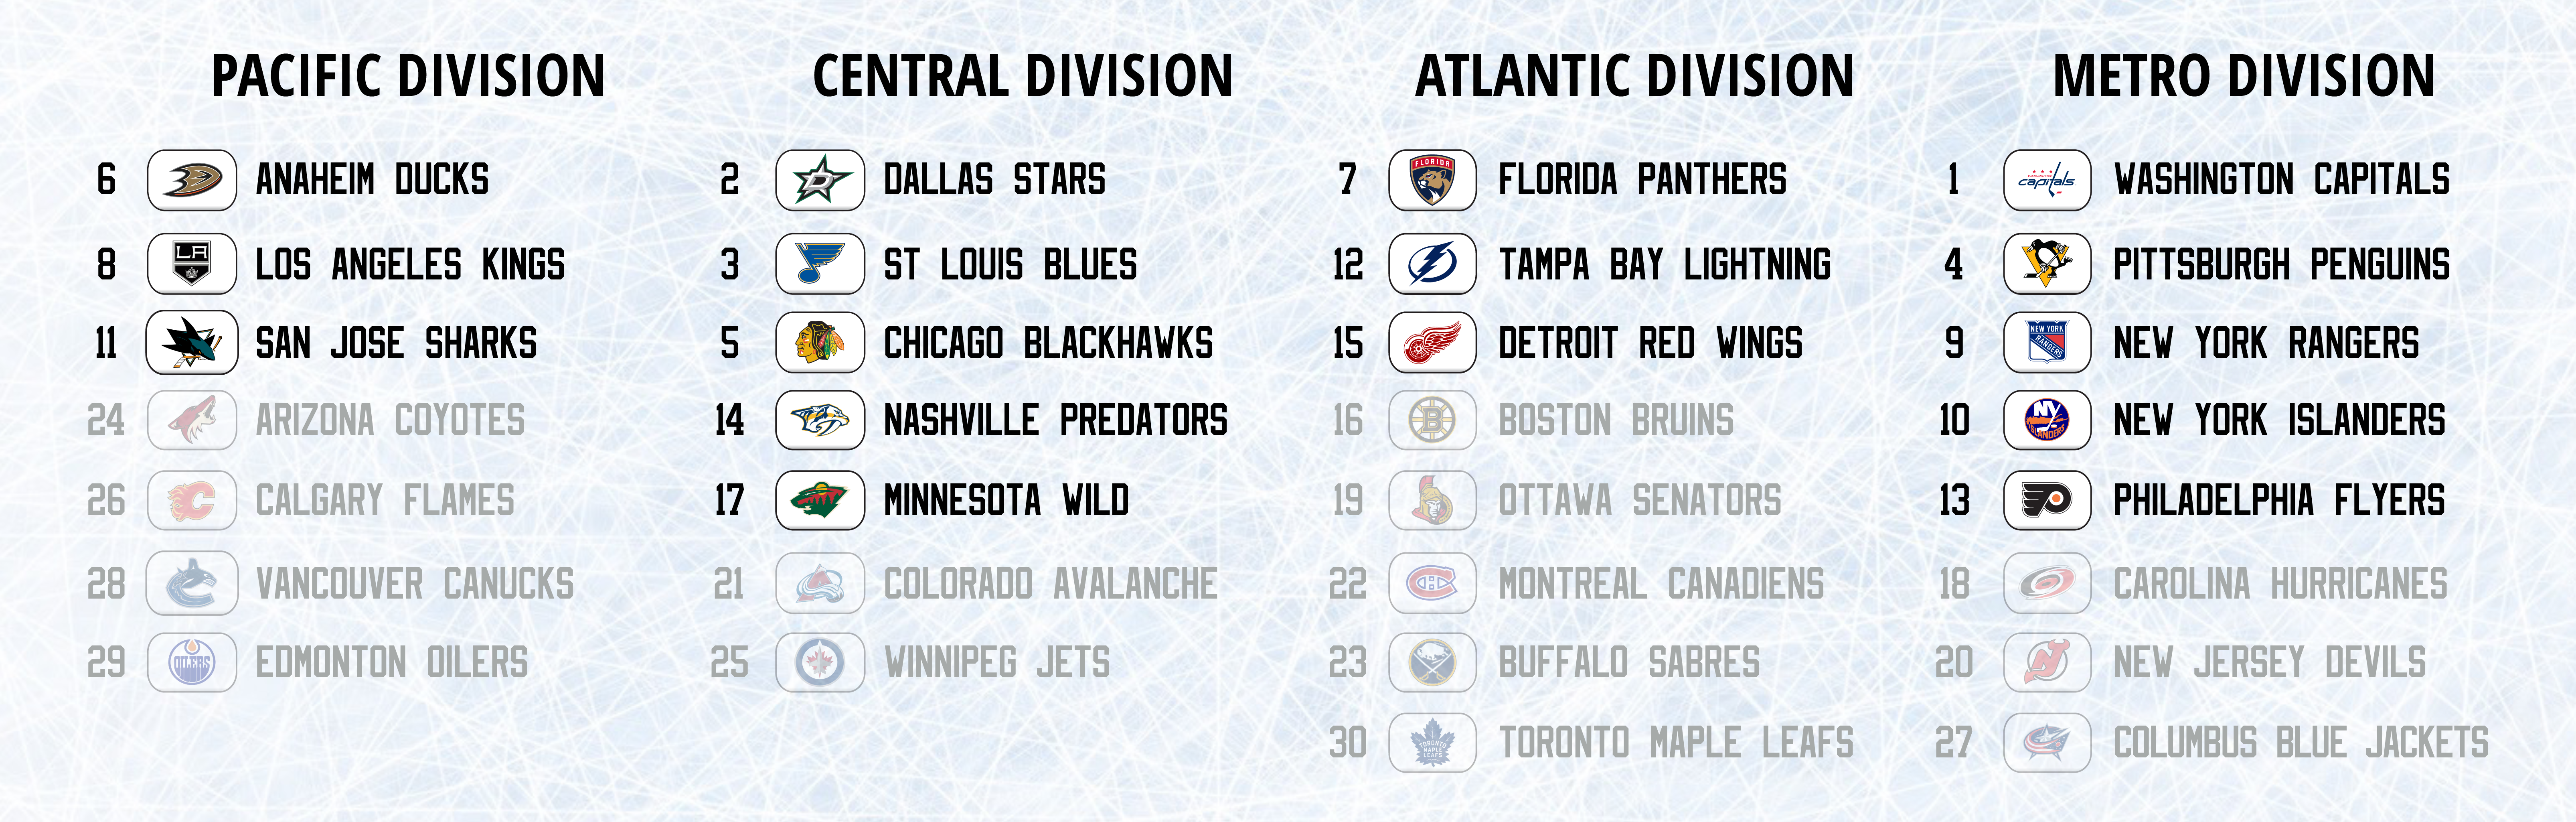
Wild Card Divisional Alignment/Playoff Format
Finally, the current playoff format, “Wild Card Divisional” as I call it, returns to a 4-Division setup (within the 2 Conferences), but instead of the top 4 qualifying for the playoffs, the top 3 in each Division qualify automatically (setting a #2/3 matchup in each), plus the next 2 best teams in the Conference (which can be one from each Division or two from the same). These 2 “Wild Card” teams match up against the 2 Division winners, in order of best-to-worst record:
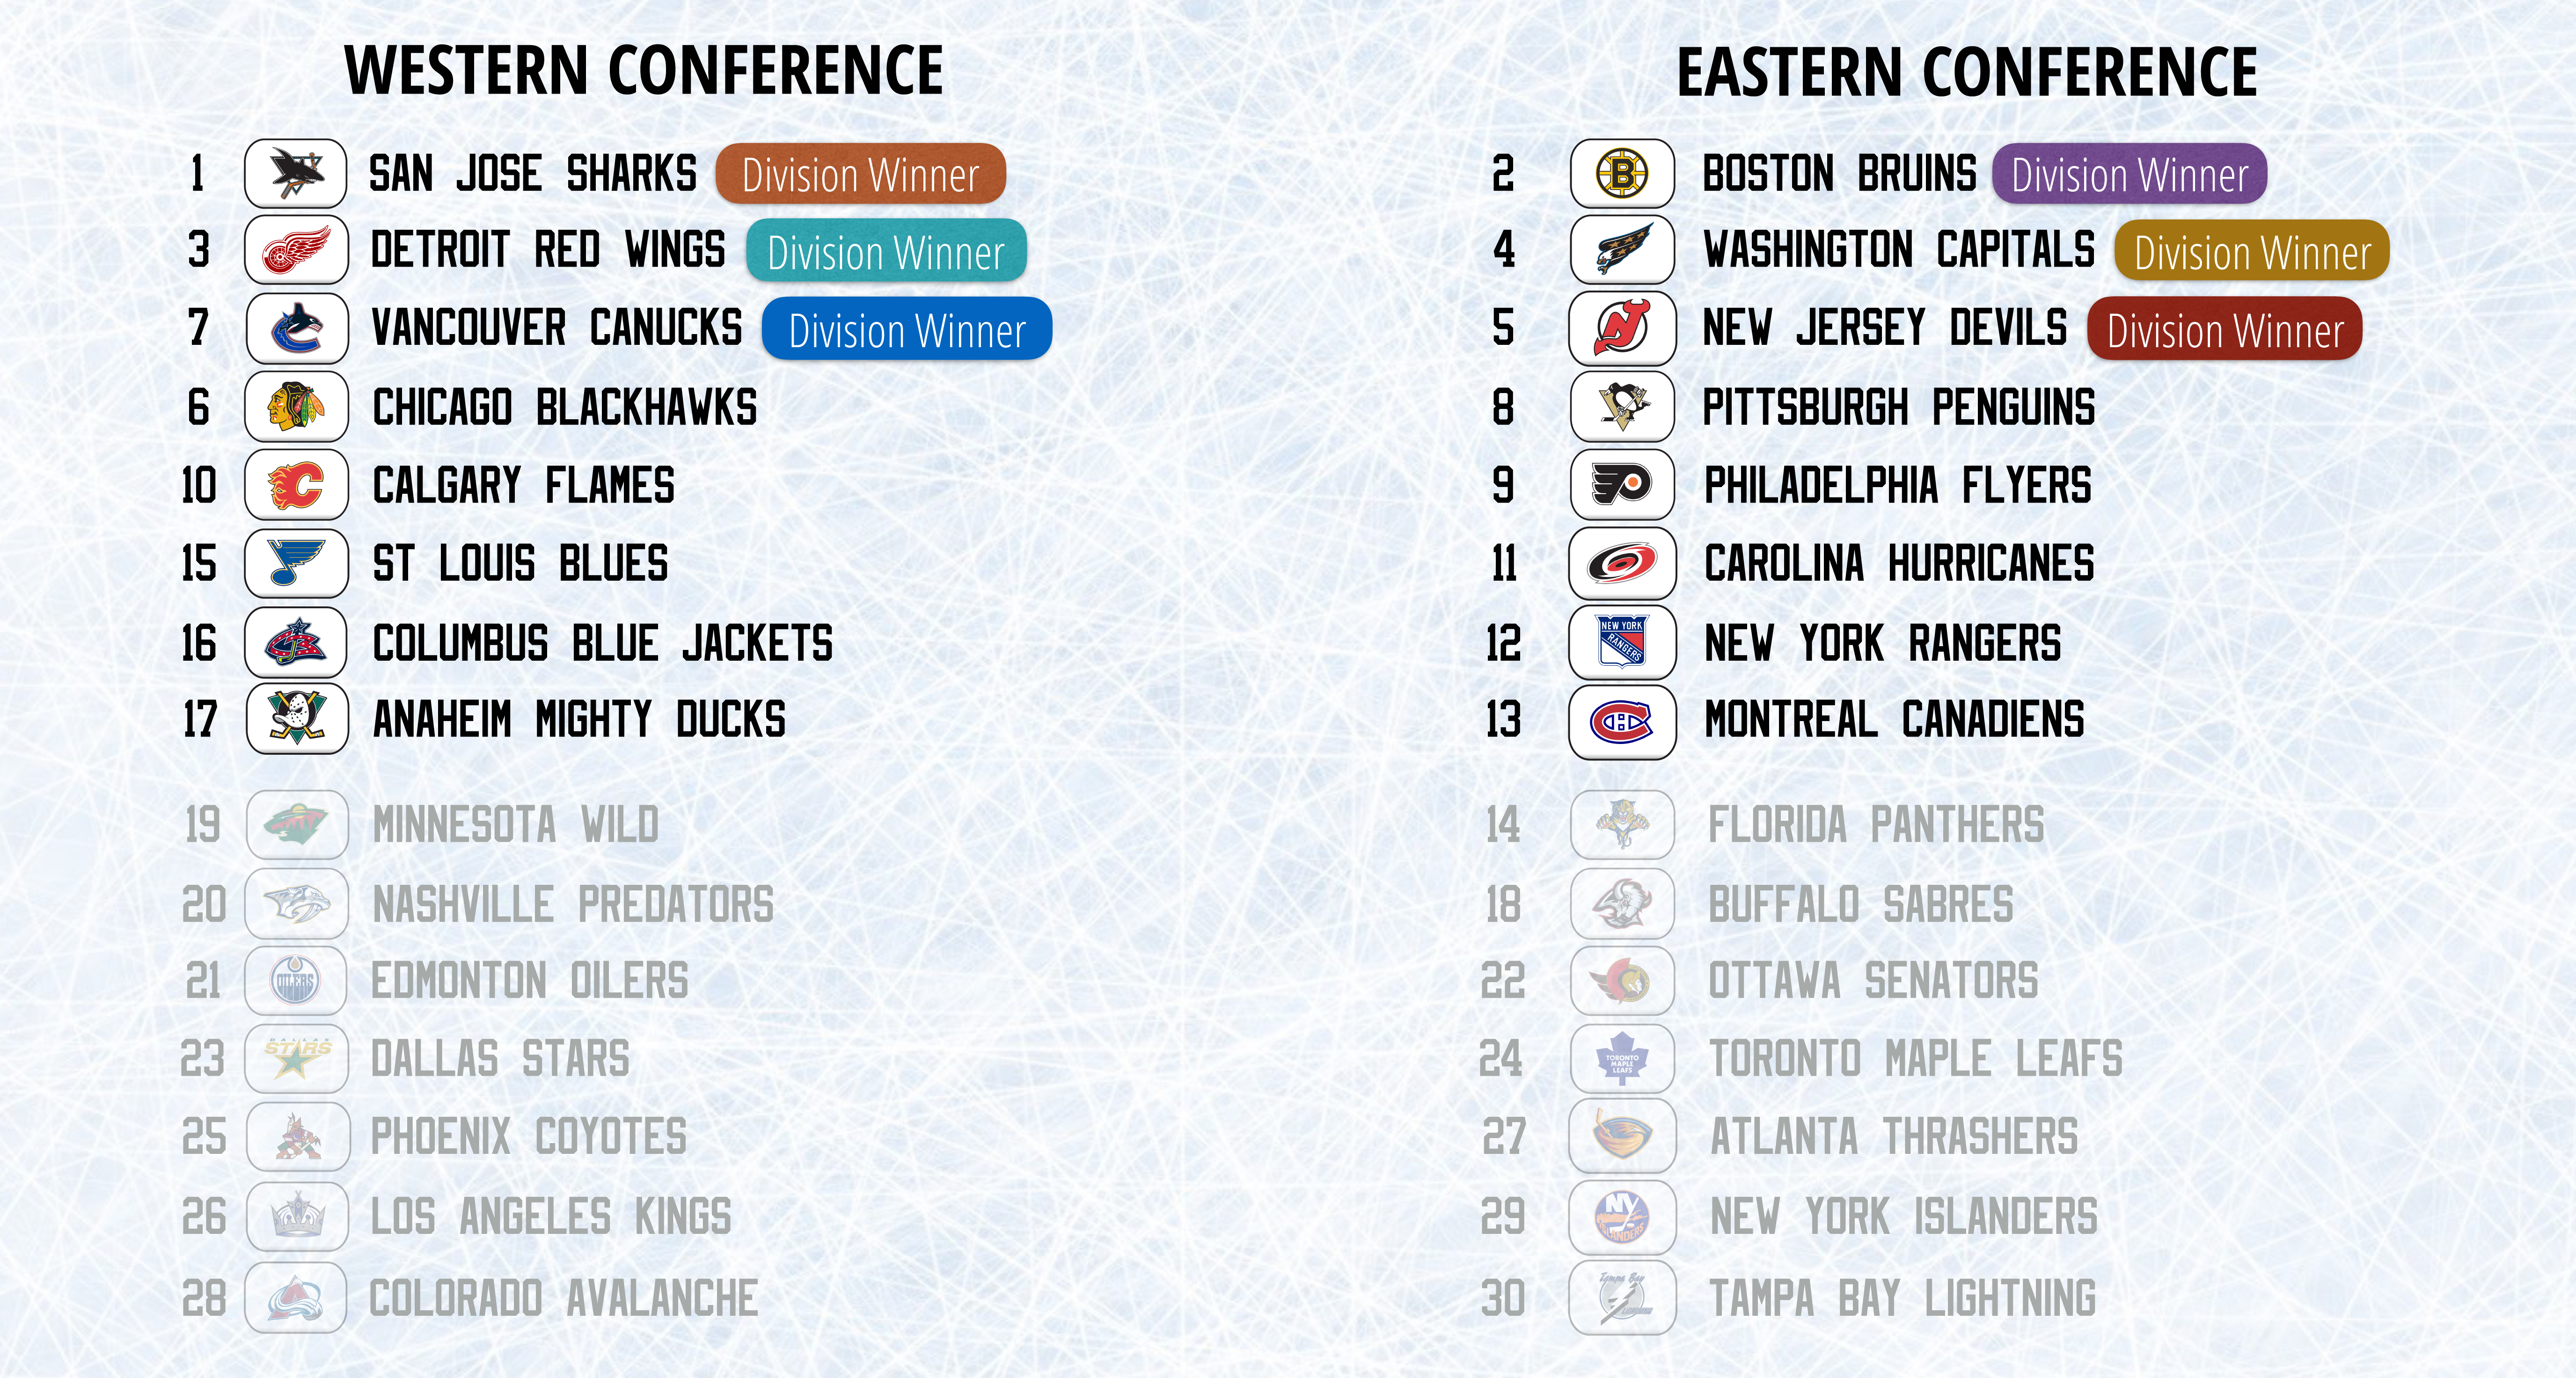
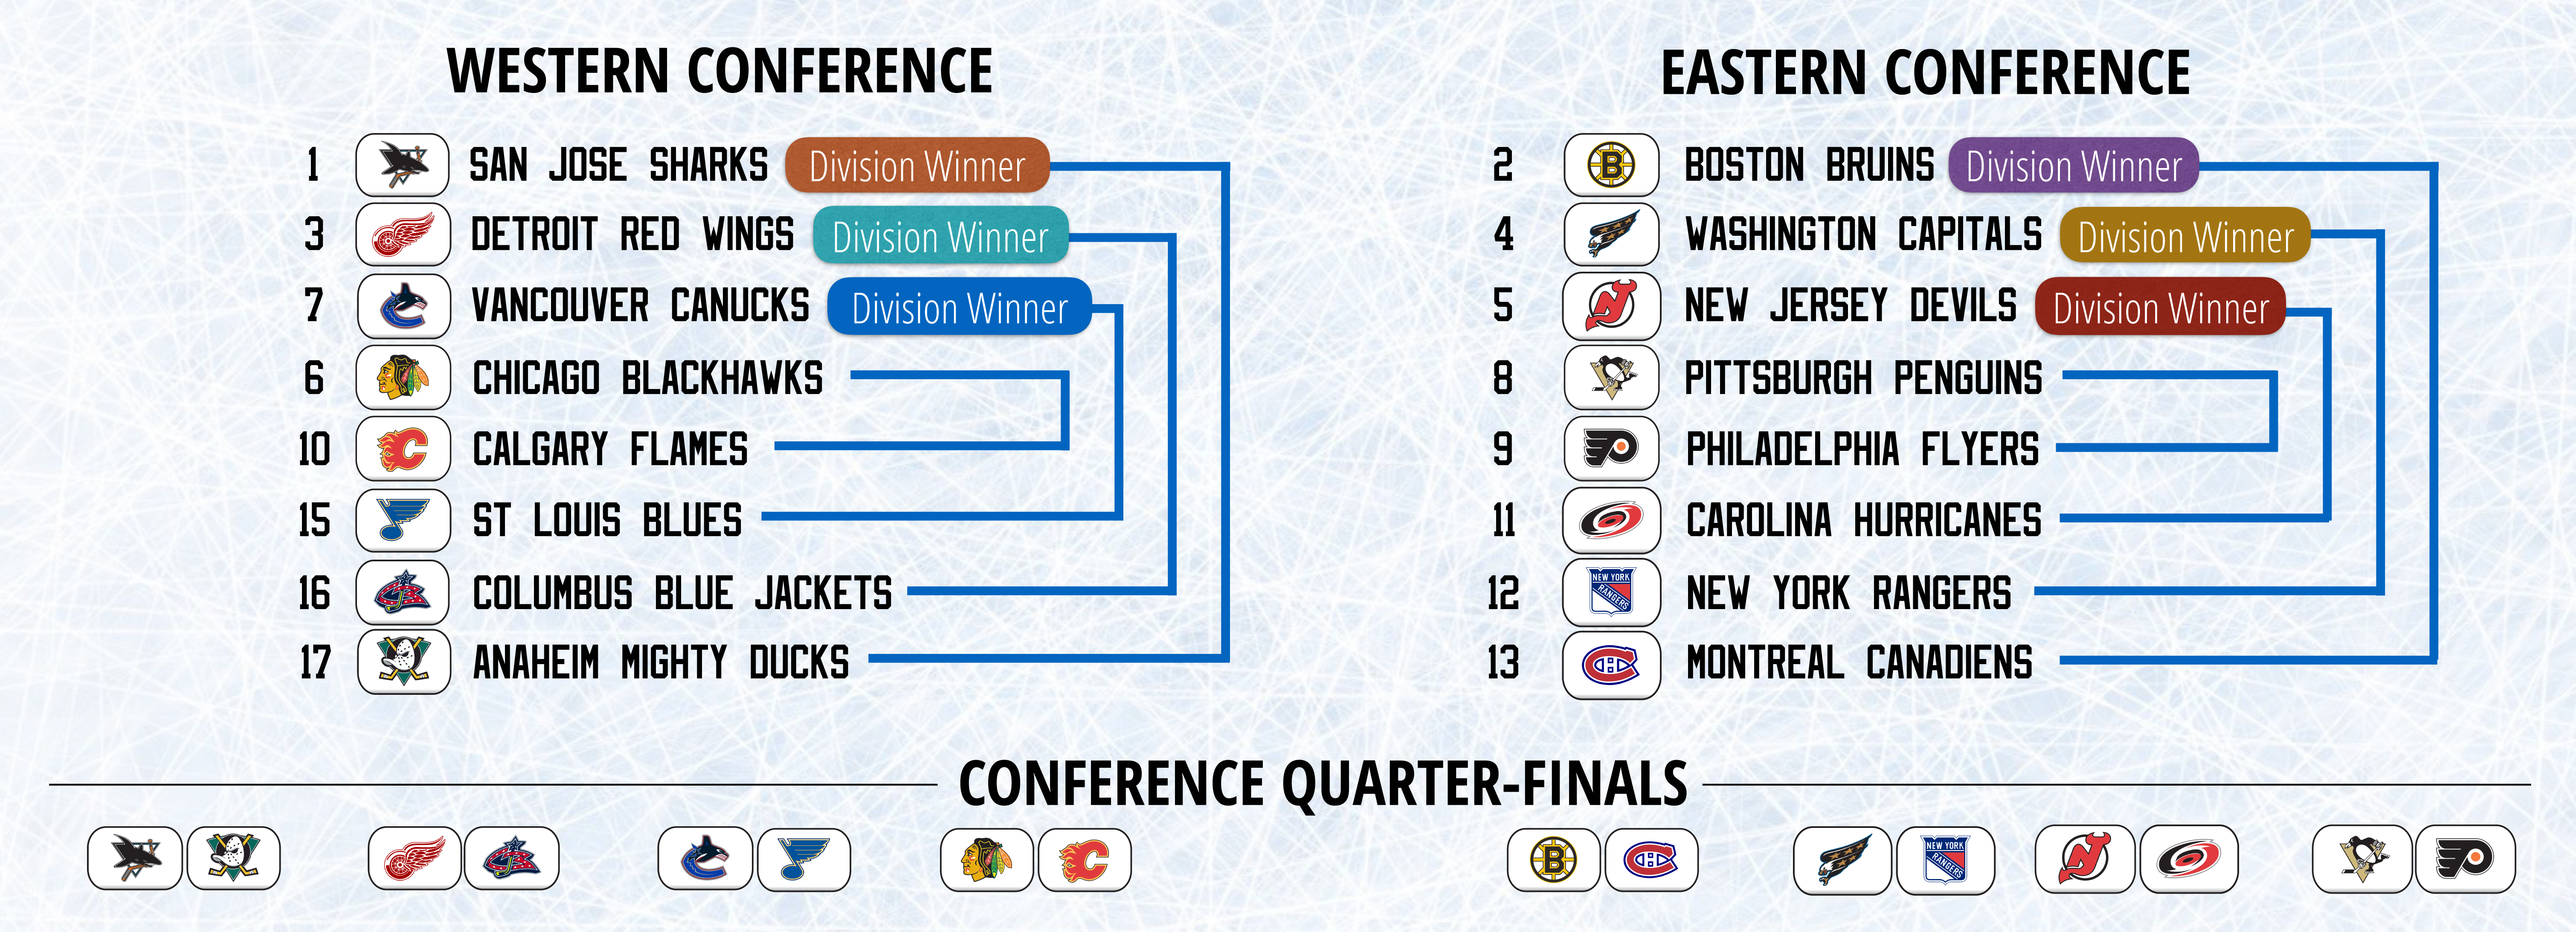
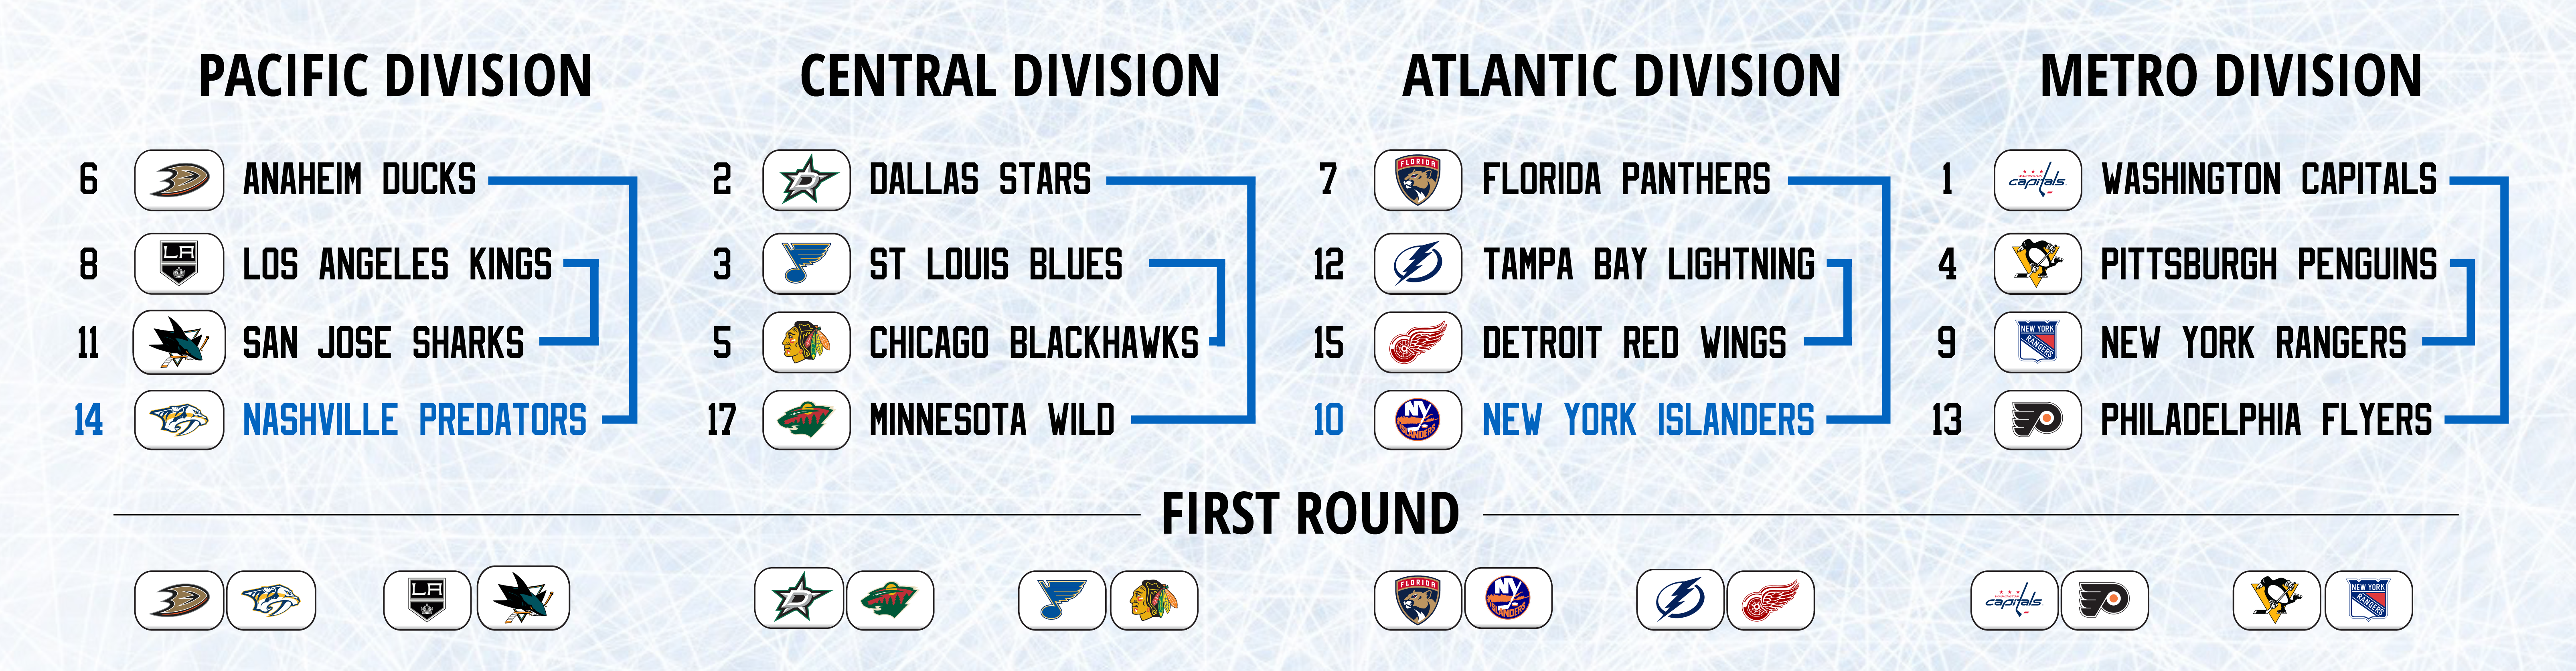
An “ideal” instance of this format would be its first year, 2014:
Dallas moves to the Pacific bracket since they draw Anaheim by being the lowest wild card team, while Anaheim is the highest Division winner:
This year, all of the top 16 teams happened to qualify for the playoffs, but there is a distinct disparity in the relative strength of the Divisions: Central is the strongest, Metro is weakest – thus, the fairness of the matchups is adversely affected (#4 vs. #7, #12 vs. #13)
In the second round, because of the brackets, #1 Boston faces #9 Montreal, while #6 Pittsburgh faces #12 NY Rangers. Dallas was eliminated in the 1st Round, however, if they had won, they would have drawn Los Angeles (another 2-time zone travel series), rather than possibly matching up against a Central team (Chicago or Minnesota), also due to bracketing the matchups despite the crossovers.
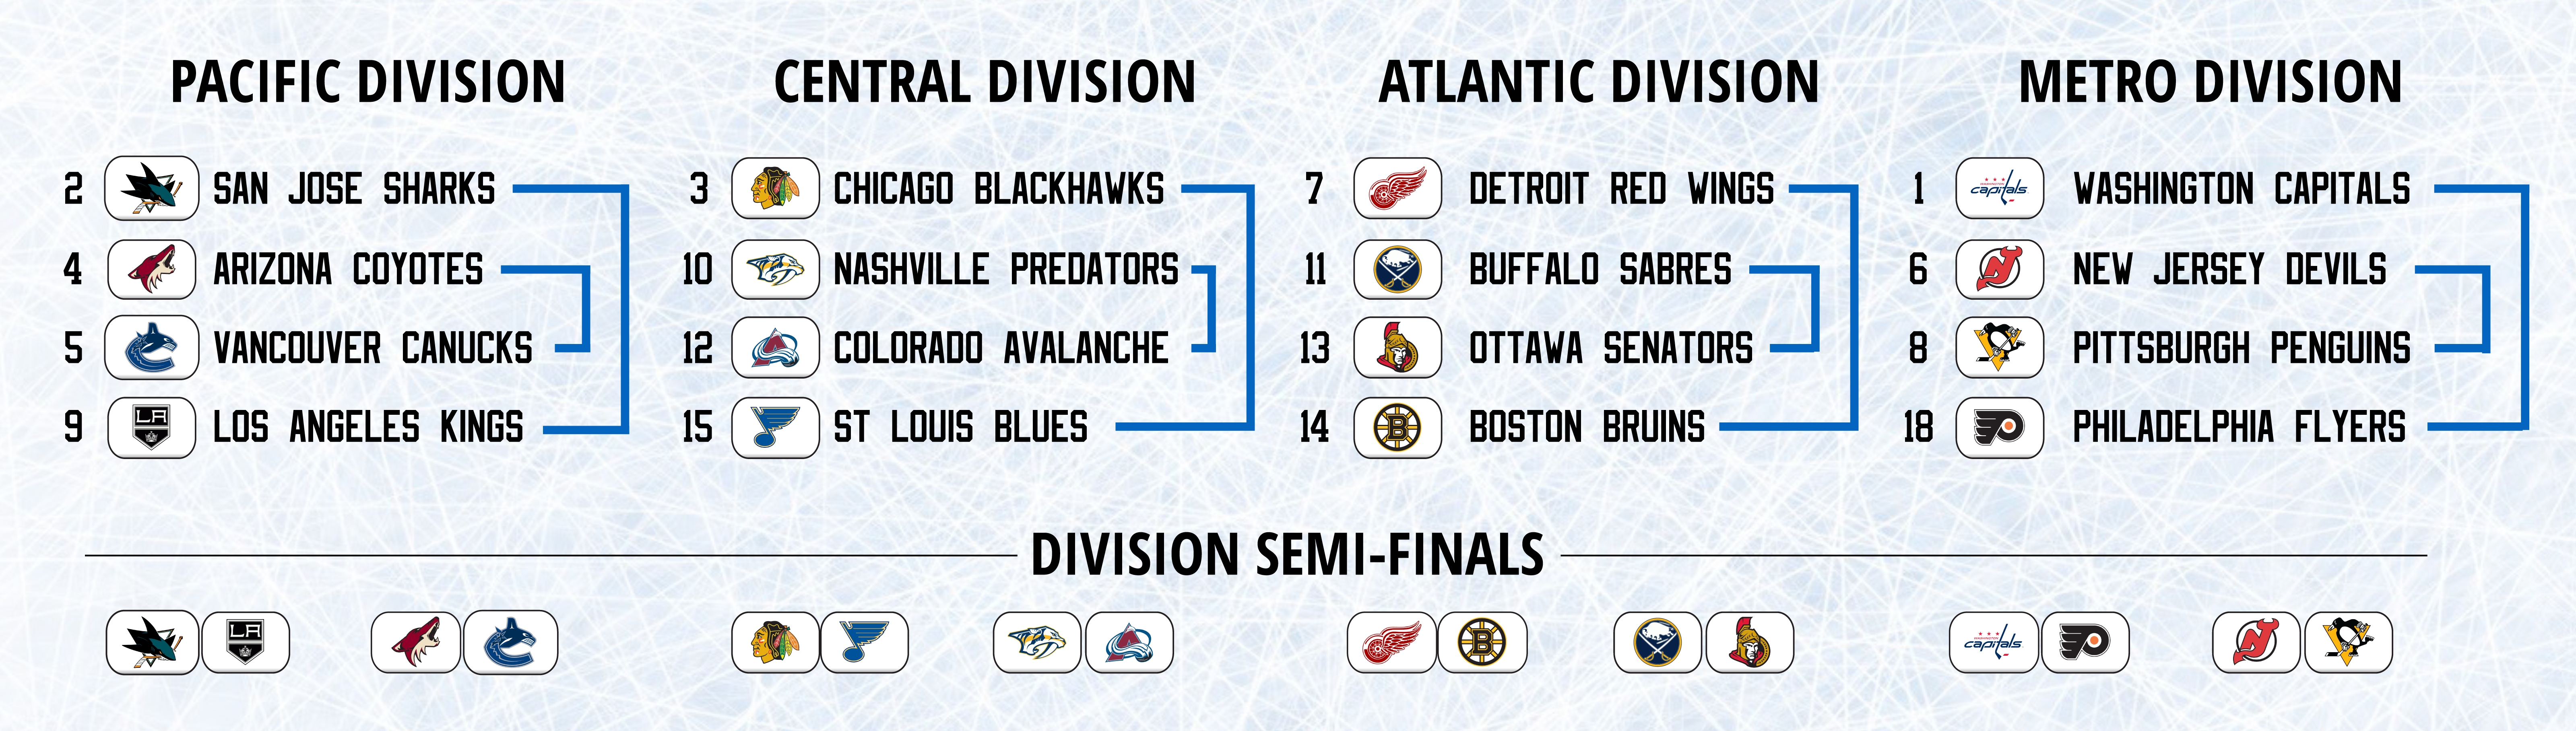
2016 provides a more problematic example:
Here, #3 St. Louis draws #5 Chicago, #4 Pittsburgh draws #9 NY Rangers, and #12 Tampa Bay draws #15 Detroit. Not only that, but because of the strength of the Metro Division, the #4 Metro seed (NY Islanders) gets an easier matchup than the #3 seed (NY Rangers), since the #2 Metro seed has a better record than the Atlantic Division winner (Florida).
On top of that, the playoff team with the worst record is Detroit, but since they were #3 in the Atlantic Division, they draw the #2 Atlantic seed (Tampa Bay), and the #1 overall team (Washington) draws a team with a better record than Detroit (Philadelphia).
This time, the second round has two series in which a Wild Card team moved on and faced another team in the opposite Division (Nashville and NY Islanders): in the former case, this meant another 2 time zone series.
Additionally, the Tampa Bay-NY Islanders series had home ice advantage go the team with the worse record because of bracket seeding (technically, Tampa Bay is #2, and NY Islanders are #4).
The matchups are also very unfair: #2/#3, #1/#4, #11/#14, and #12/#10.
It can easily be concluded that this format is relatively complex, and would benefit from re-seeding and less restriction to brackets to determine its matchups.
All logos © National Hockey League or respective owners, used for purpose of graphic aid only
Ice background © Artsfon wallpapers